JVM Micrometer
Dashboard for Micrometer instrumented applications (Java, Spring Boot, Micronaut). Data from prometheus (which auto install by istio service-mesh on Kubernetes)
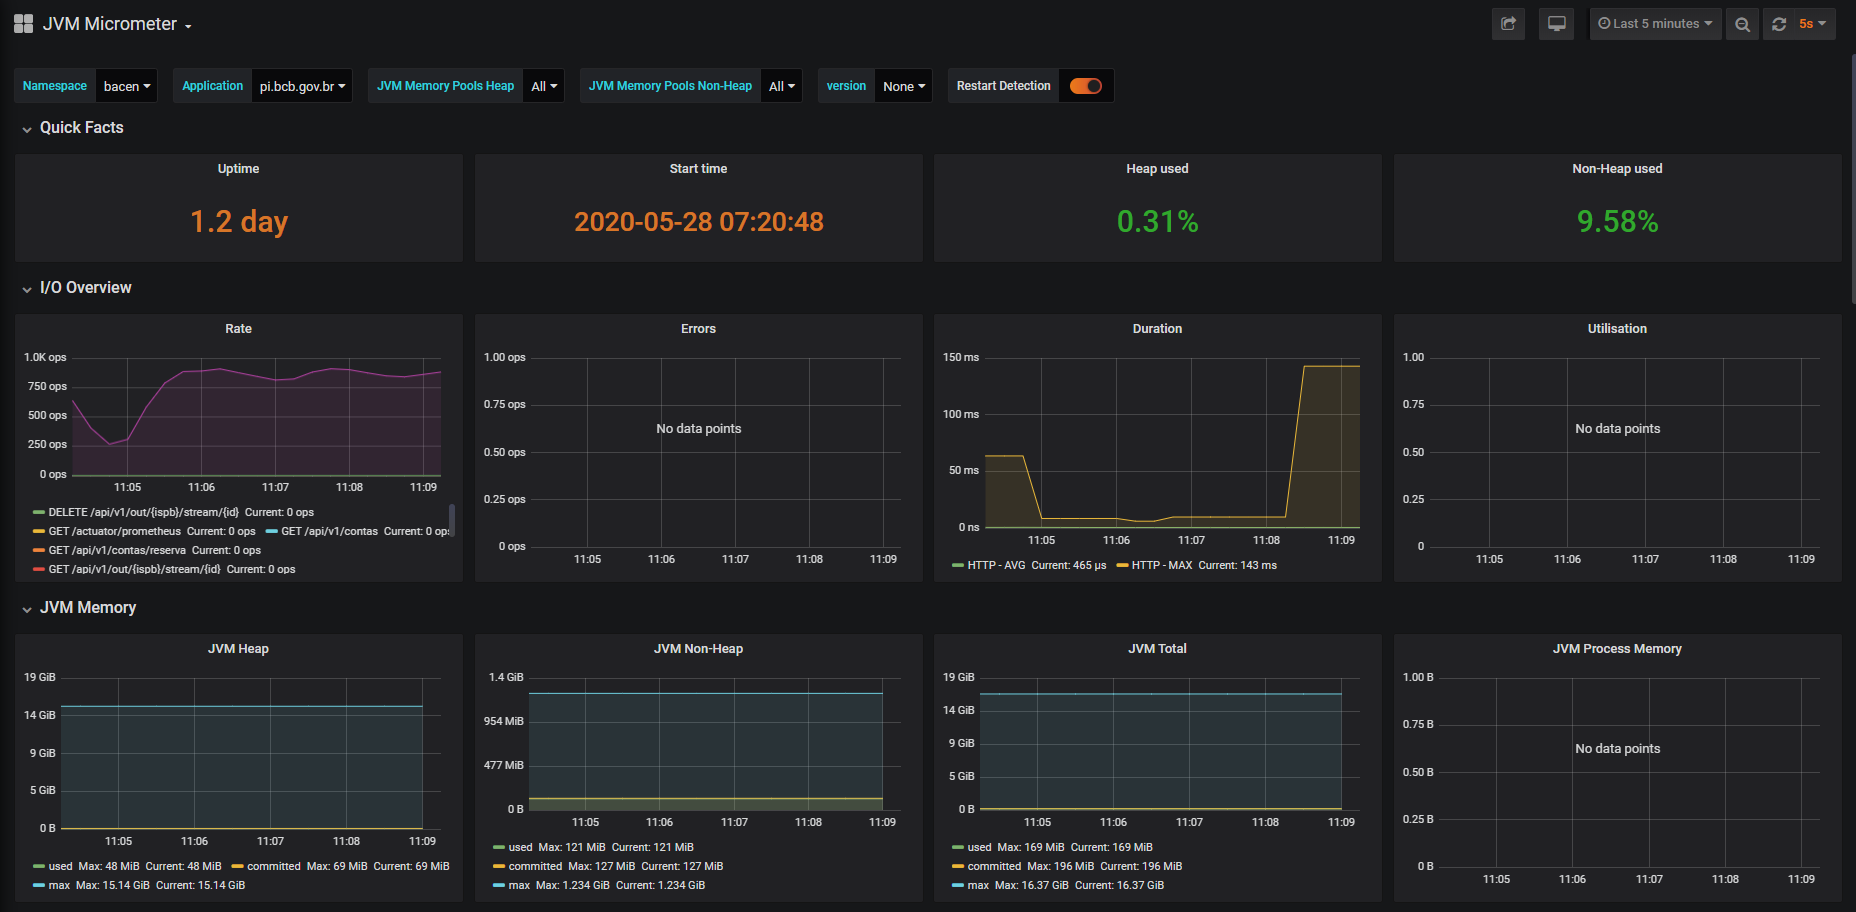
The JVM Micrometer dashboard uses the prometheus data source to create a Grafana dashboard with the graph and singlestat panels.
Data source config
Collector type:
Collector plugins:
Collector config:
Revisions
Upload an updated version of an exported dashboard.json file from Grafana
| Revision | Description | Created | |
|---|---|---|---|
| Download |
Java Virtual Machine (JVM)
Easily monitor a Java virtual machine, which allows computers to run Java programs, with Grafana Cloud's out-of-the-box monitoring solution.
Learn more