NGINX LOGS & GEO MAP
Nginx Logs and GEO map
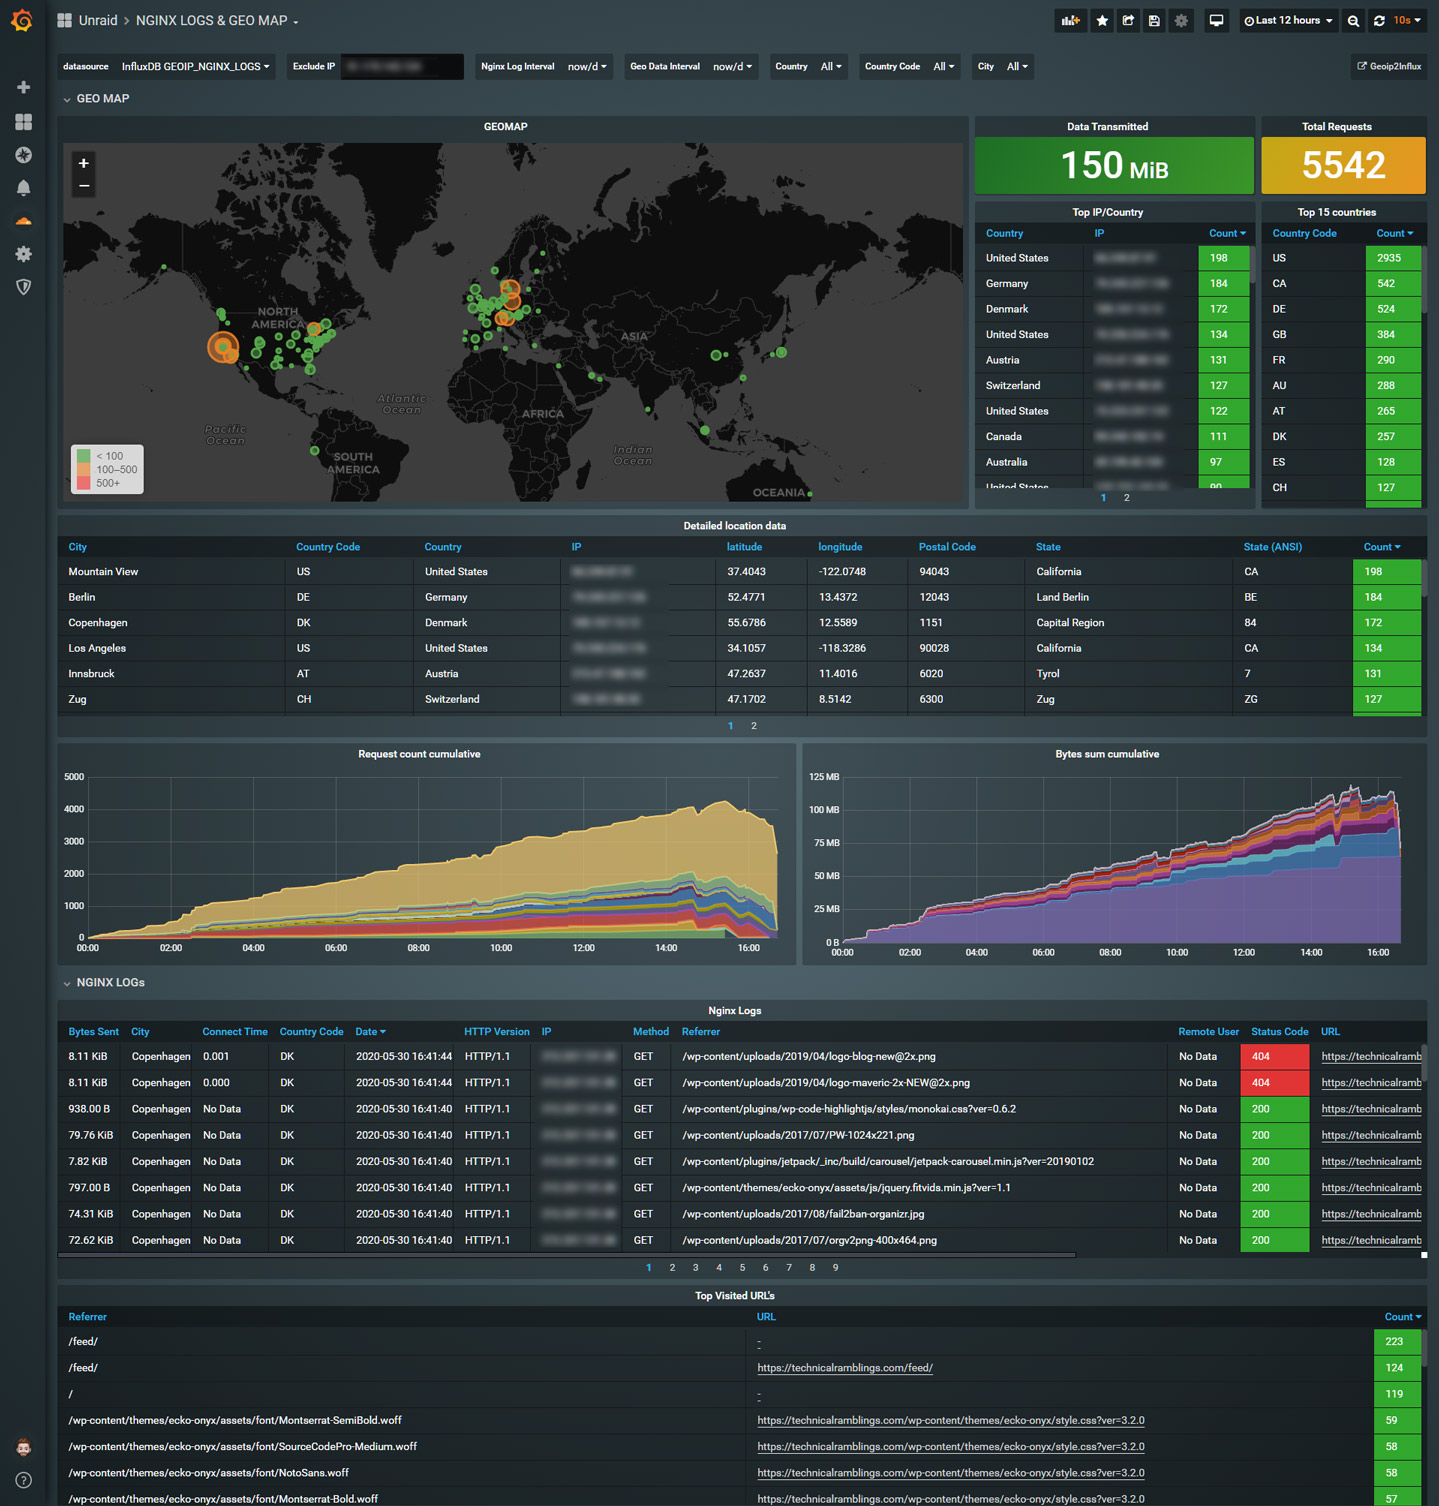
Nginx Logs and GEO map dashboard for the linuxserver/letsencrypt Geoip2Influx docker mod.
Needs the grafana-worldmap-panel
Instructions:
linuxserver/swag dockermod:
https://github.com/linuxserver/docker-mods/tree/swag-geoip2influx
Standalone docker container:
See https://github.com/gilbN/geoip2influx for a dashboard that supports latest version of Grafana
https://github.com/gilbN/geoip2influx
Updates:
10.08.24: See https://github.com/gilbN/geoip2influx for a dashboard that supports latest version of Grafana
23.01.21: Set Top visited domains/Top IP/Top 15 countries to the new table visualization
22.06.20 : Added domain variable filtering.
21.06.20: Added domain in nginx logs
18.06.20: Added city, country code and country name variable filter to nginx logs
30.05.20: Fixed city variable
25.05.20: Added more drilldown variables. Country,City,Country Code
22.05.20: Added Exclude IP variable and Time interval variables
Data source config
Collector config:
Upload an updated version of an exported dashboard.json file from Grafana
| Revision | Description | Created | |
|---|---|---|---|
| Download |
Grafana Loki (self-hosted)
Easily monitor Grafana Loki (self-hosted), a horizontally scalable, highly available, multi-tenant log aggregation system inspired by Prometheus, with Grafana Cloud's out-of-the-box monitoring solution.
Learn more