Caringo Swarm System Monitoring v11.1
Example Dashboard to monitor Caringo Swarm v11 and higher
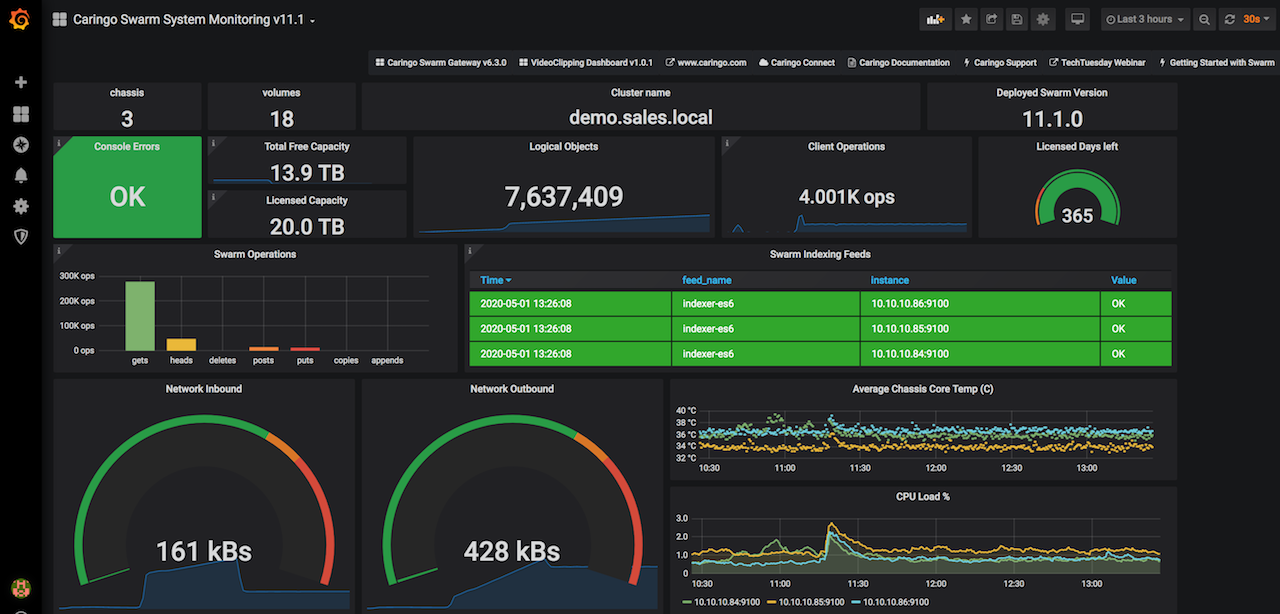
This dashboard is an example of how to visualize metrics provided by Caringo Swarm v11.1 and above. See Caringo documentation on instructions for enabling Swarm metrics.
We also provide a second example dashboard for the Swarm Content Gateway v6.3.0
Fixes from previous dashboard version:
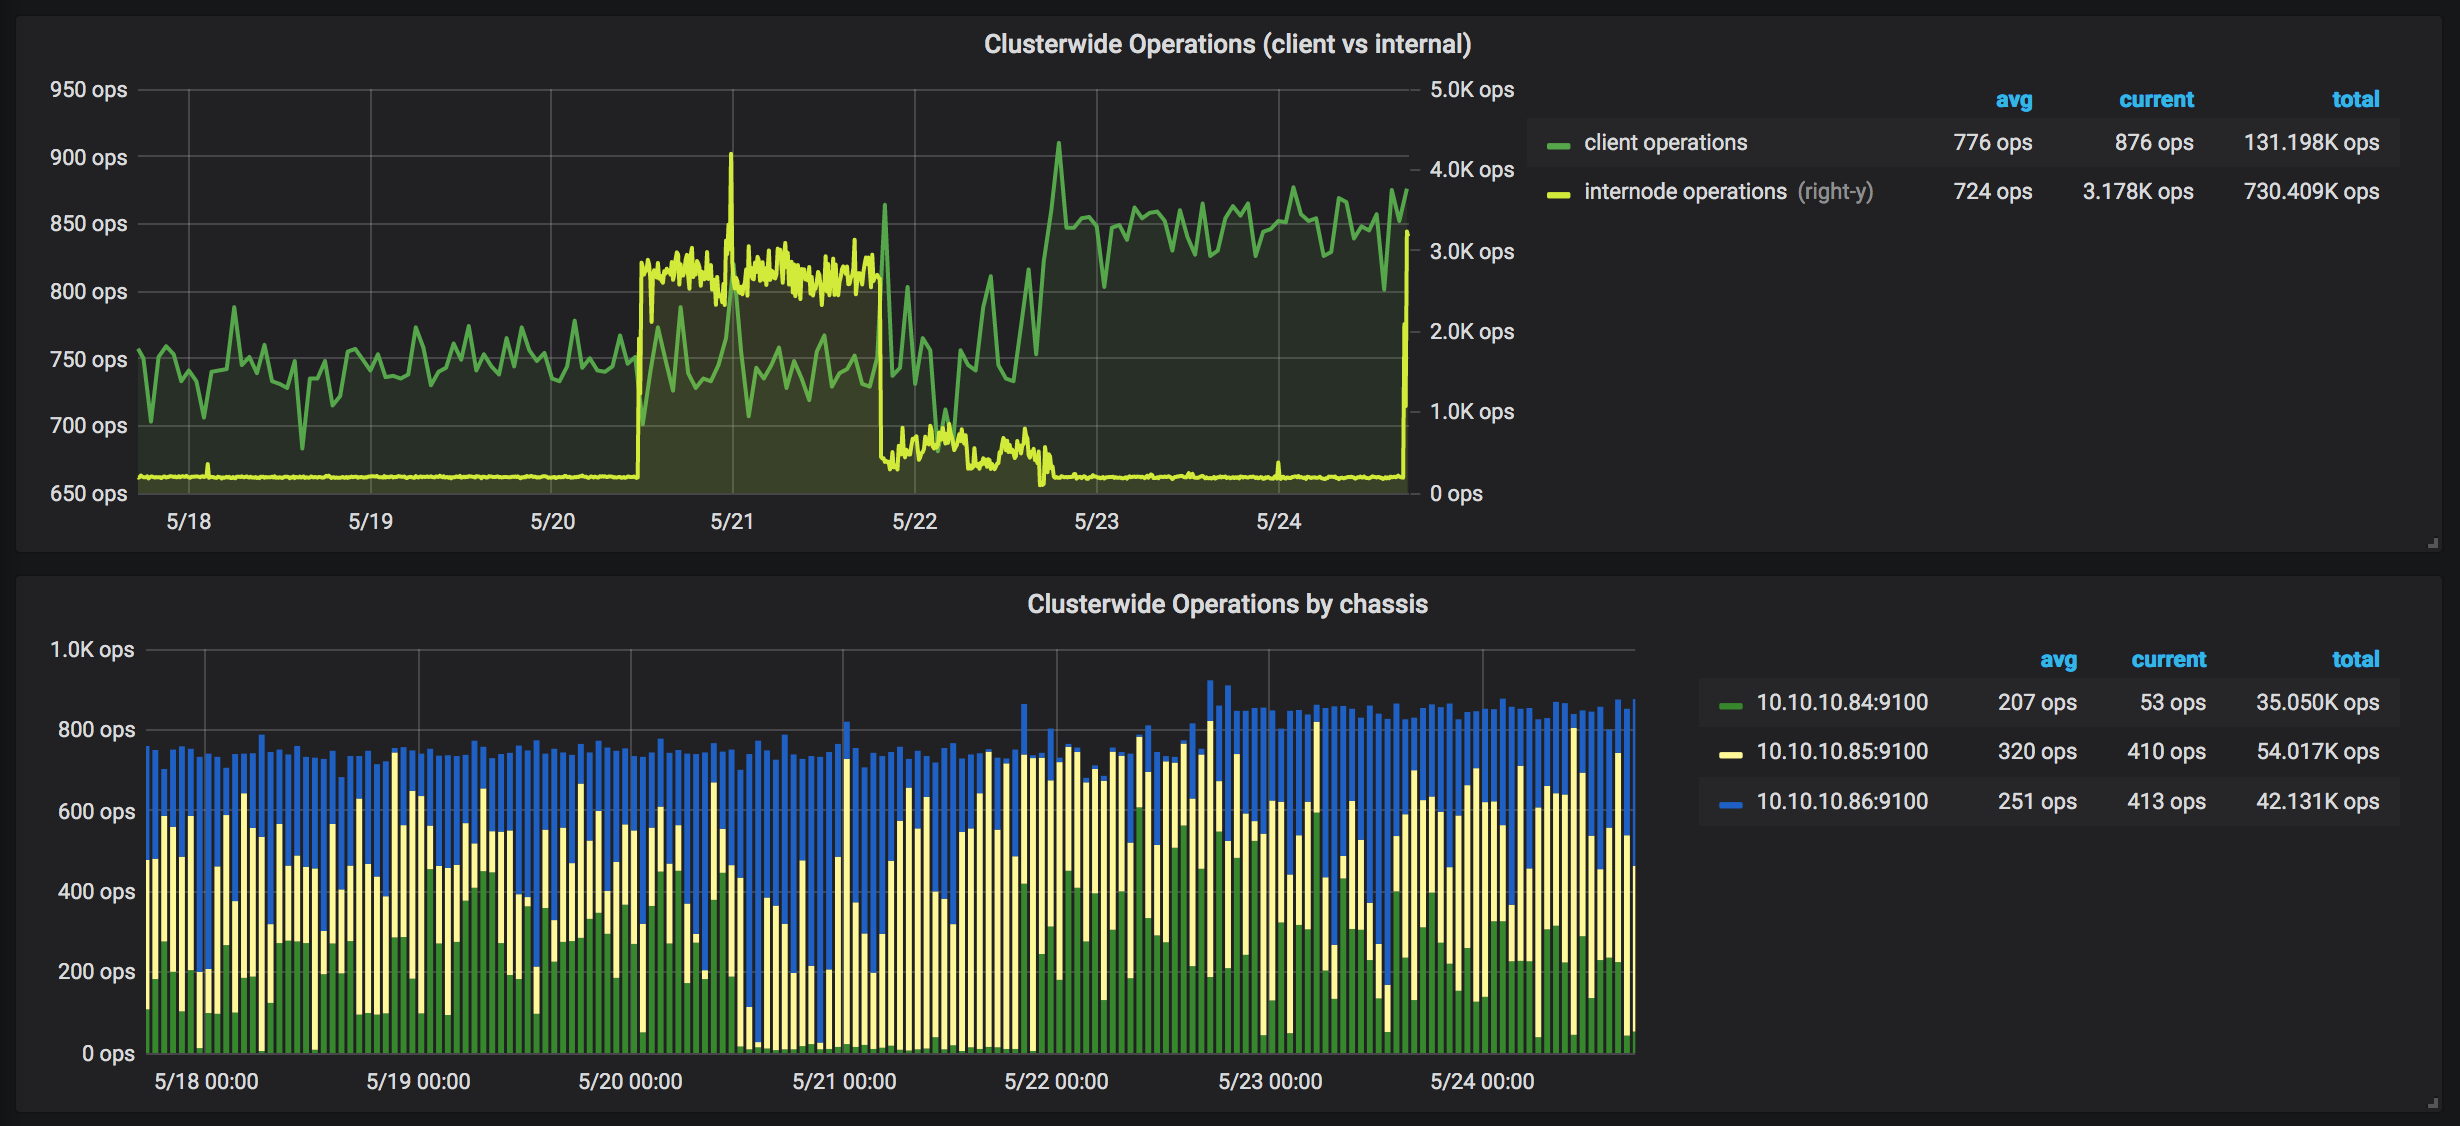
- The swarm operations panel was showing rate of change instead of totals, Swarm 11.1 introduced new metrics showing the totals for all existing SCSP operation gauges, those are now used by the swarm operations panel.
- The speedometers have had their threshold adjusted for 10Gige networking instead of 1Gige.
If you have any questions don't hesitate to contact us. The Caringo Team.
Data source config
Collector type:
Collector plugins:
Collector config:
Revisions
Upload an updated version of an exported dashboard.json file from Grafana
| Revision | Description | Created | |
|---|---|---|---|
| Download |