AKS Container Insights
Global AKS Container Insights overview. Aggregates Azure Monitor Container Insights data from multiple AKS clusters and regions in a single view. Panels include: a geomap of total Running pod counts by Azure region, a Pods inventory table with status and restart highlights, and a Containers inventory table with image and lifecycle timestamps. Uses Azure Log Analytics (Kusto) via the Azure Monitor data source and supports subscription and Log Analytics workspace template variables. Default time range is last 3h; adjust as needed for investigations.
AKS Container Insights
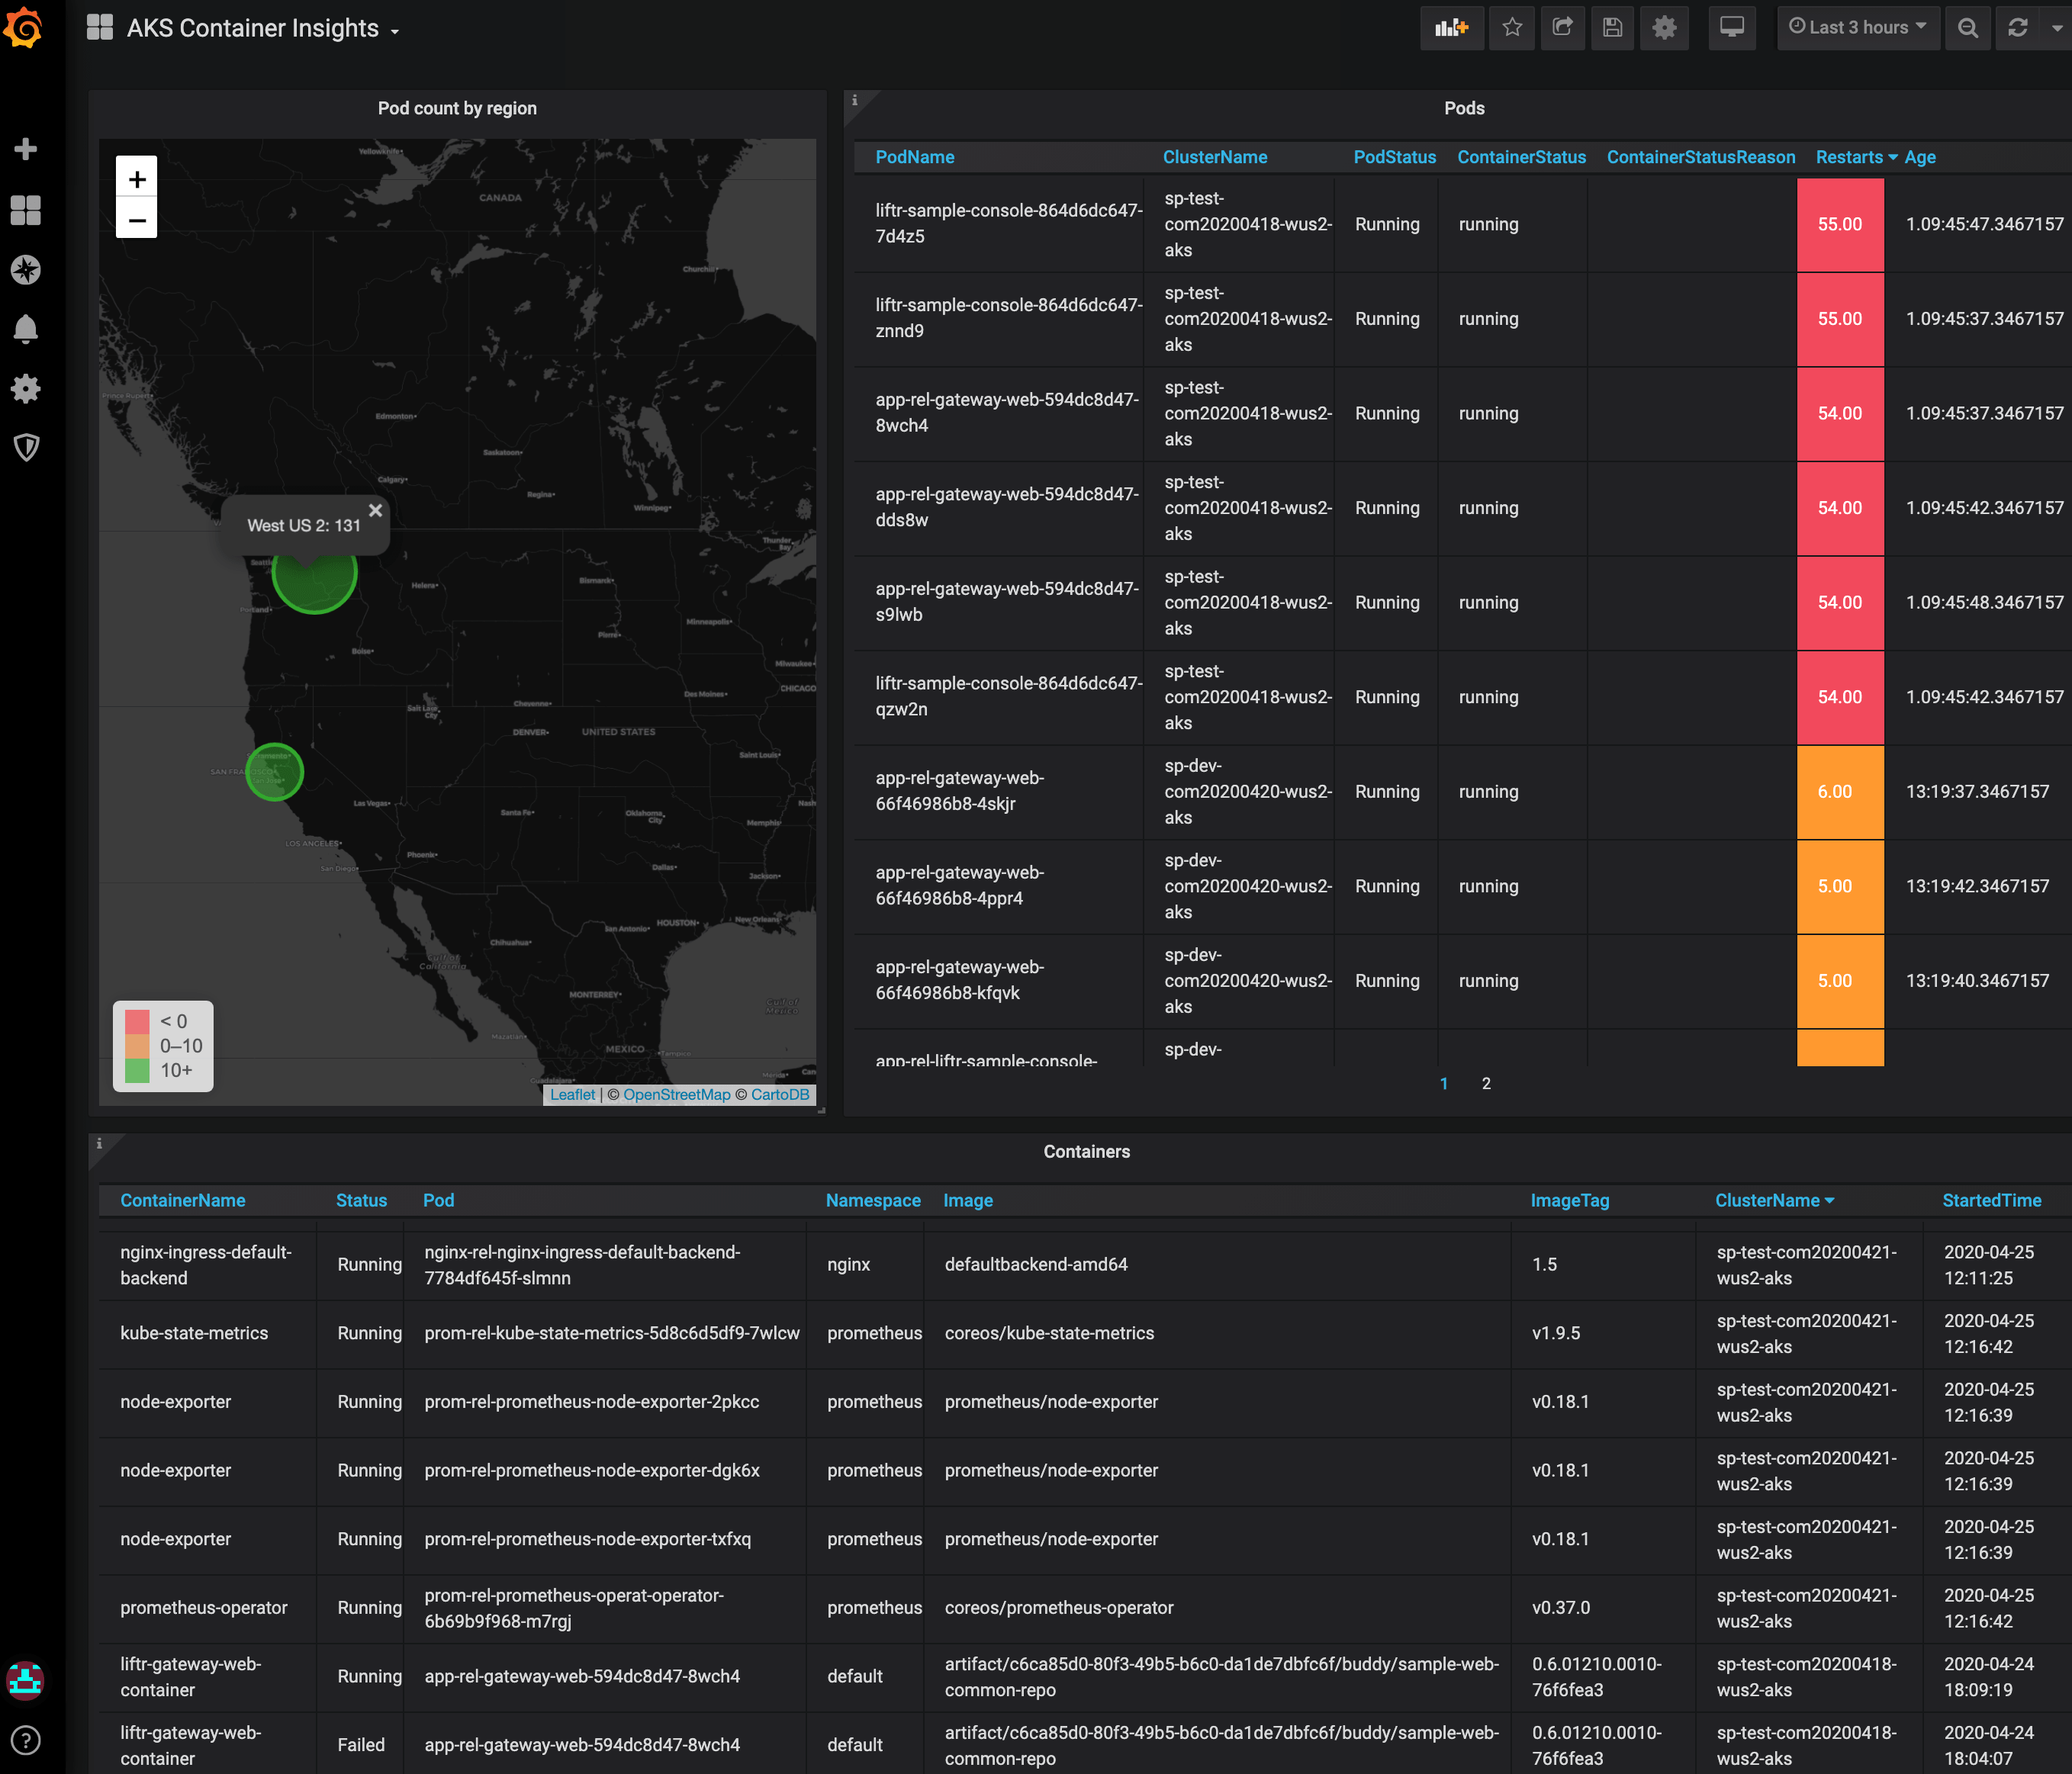
Global view for listing all the pods and the containers from multiple AKS clusters.
Screenshots


Issues and feedback
https://github.com/1w2w3y/grafana-dashboards/issues
Features
- List all the pods and their important health status.
- List all the containers, container image version, container health.
How it works?
- Each AKS cluster need to enable the Azure Monitor Container Insights.
- Azure Monitor will periodically gather the pods and containers status from the Kubernetes API server.
- The telemetry data collected from multiple AKS clusters will be sent to one Log Analytics workspace
- Grafana will query the Log Analytics workspace for the pods and containers status.
Change history
- 9/6/2025 Updated dashboard for Grafana 11.6
- 9/22/2020 Fixed the broken Kusto query for listing the clusters
- 7/9/2020 Fixed the broken container panel and updated the Dashboard to based on Grafana 7
Gallery link
https://grafana.com/grafana/dashboards/12180-aks-container-insights/
Data source config
Collector config:
Upload an updated version of an exported dashboard.json file from Grafana
| Revision | Description | Created | |
|---|---|---|---|
| Download |