Netio Power PDU
Grafana dashboard for prometheus metrics of Netio power sockets
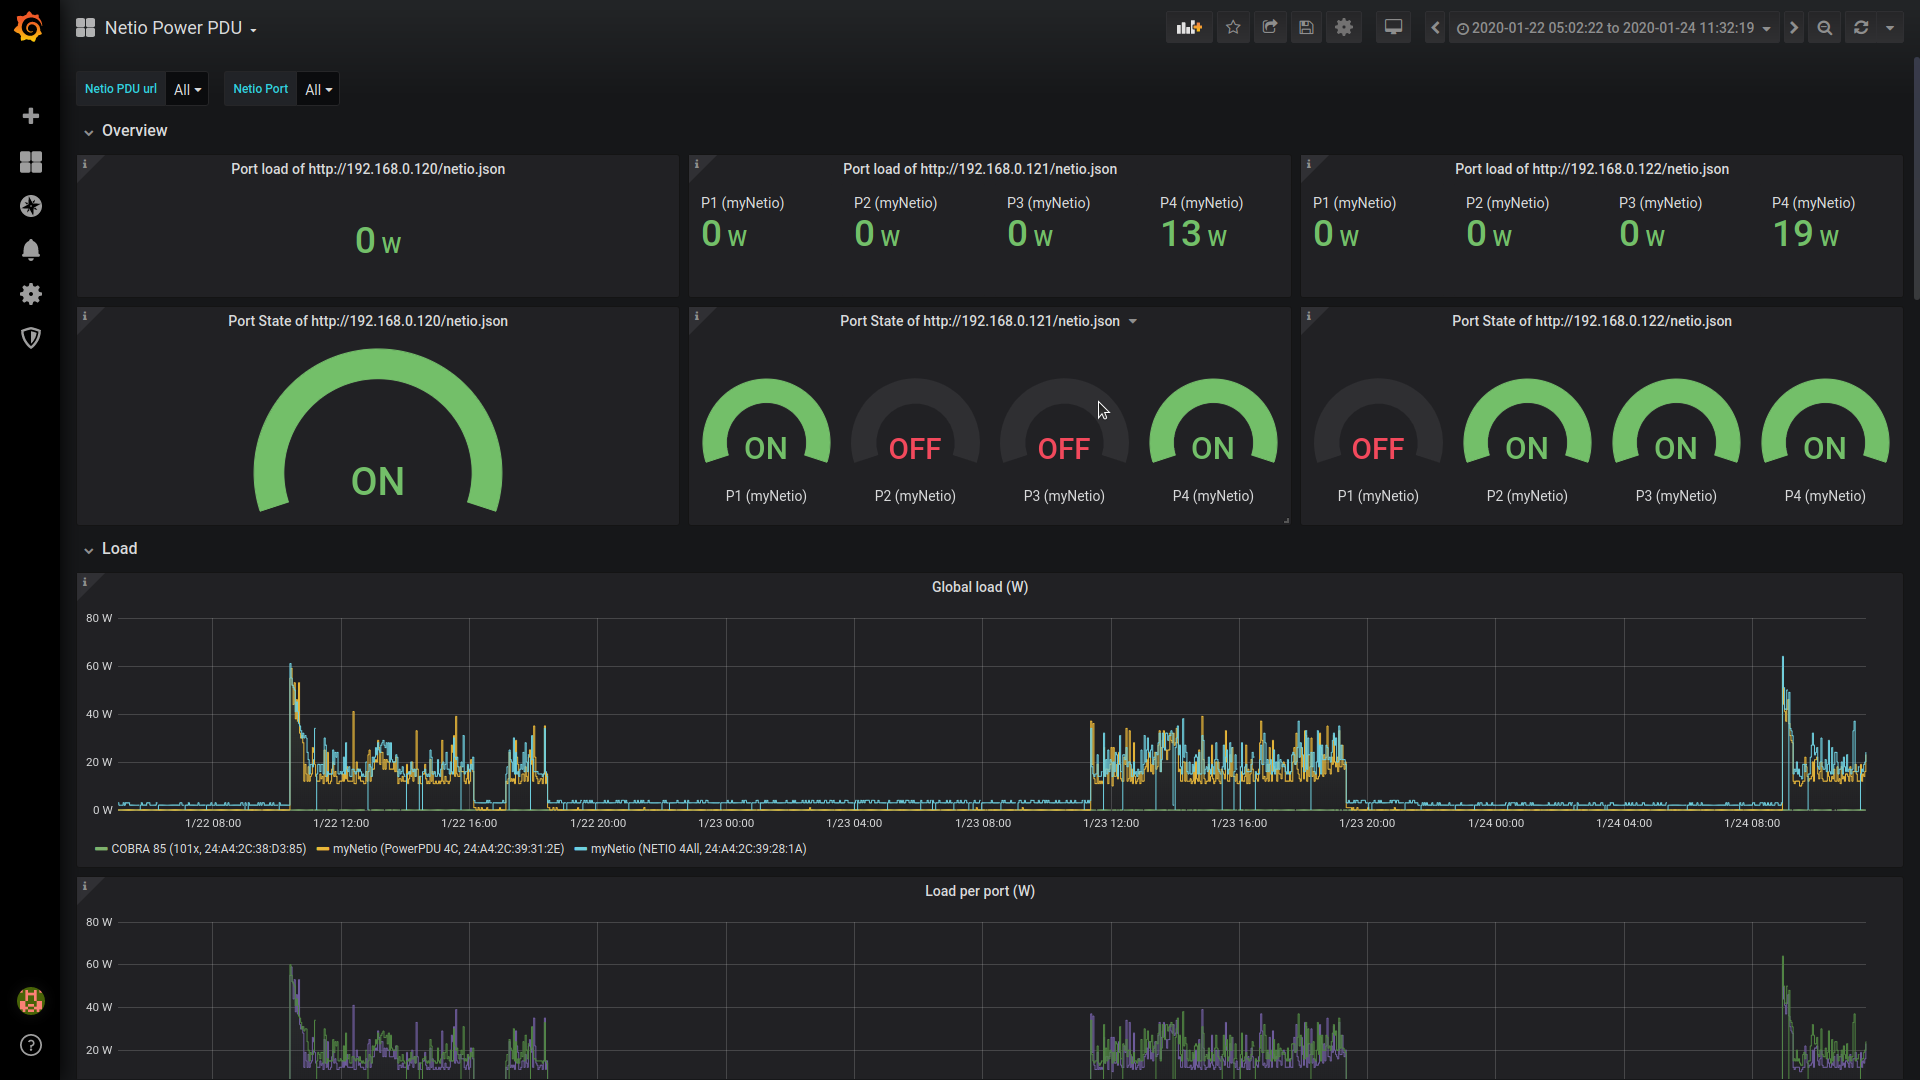
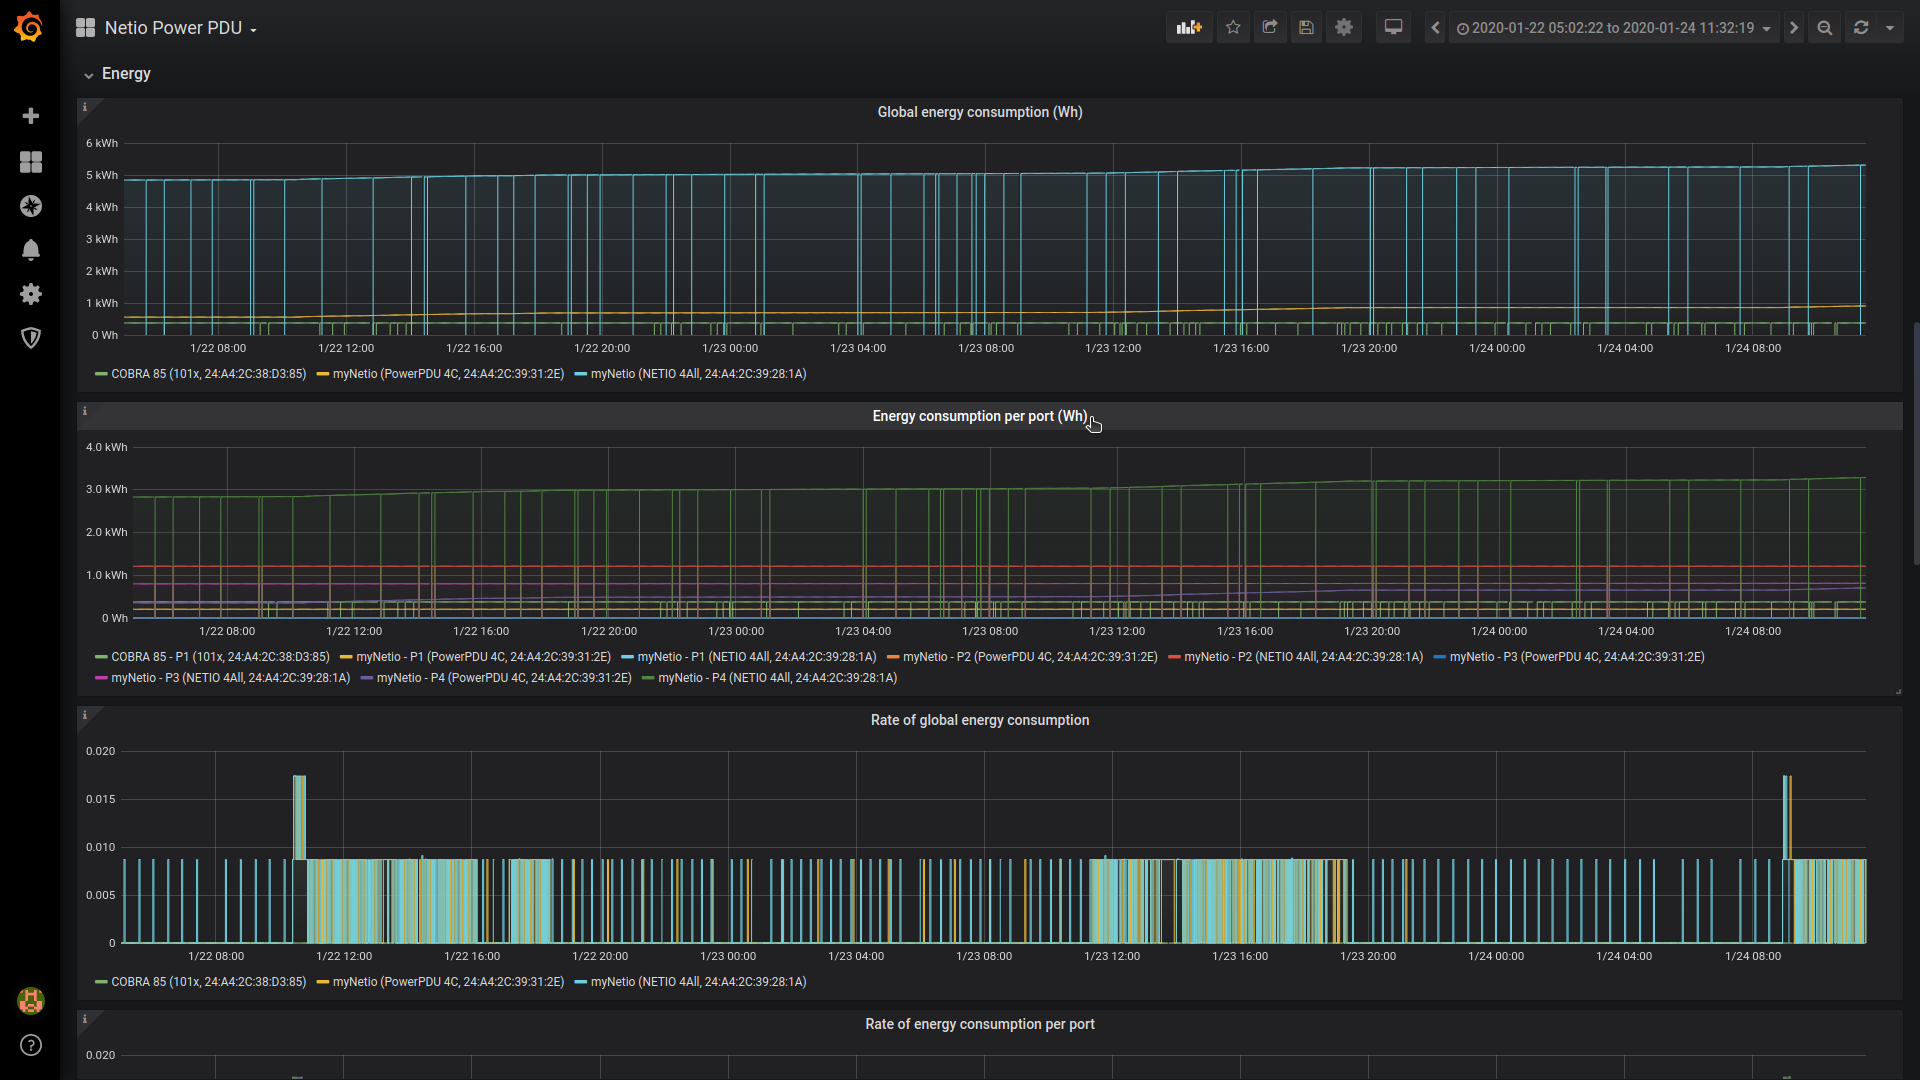
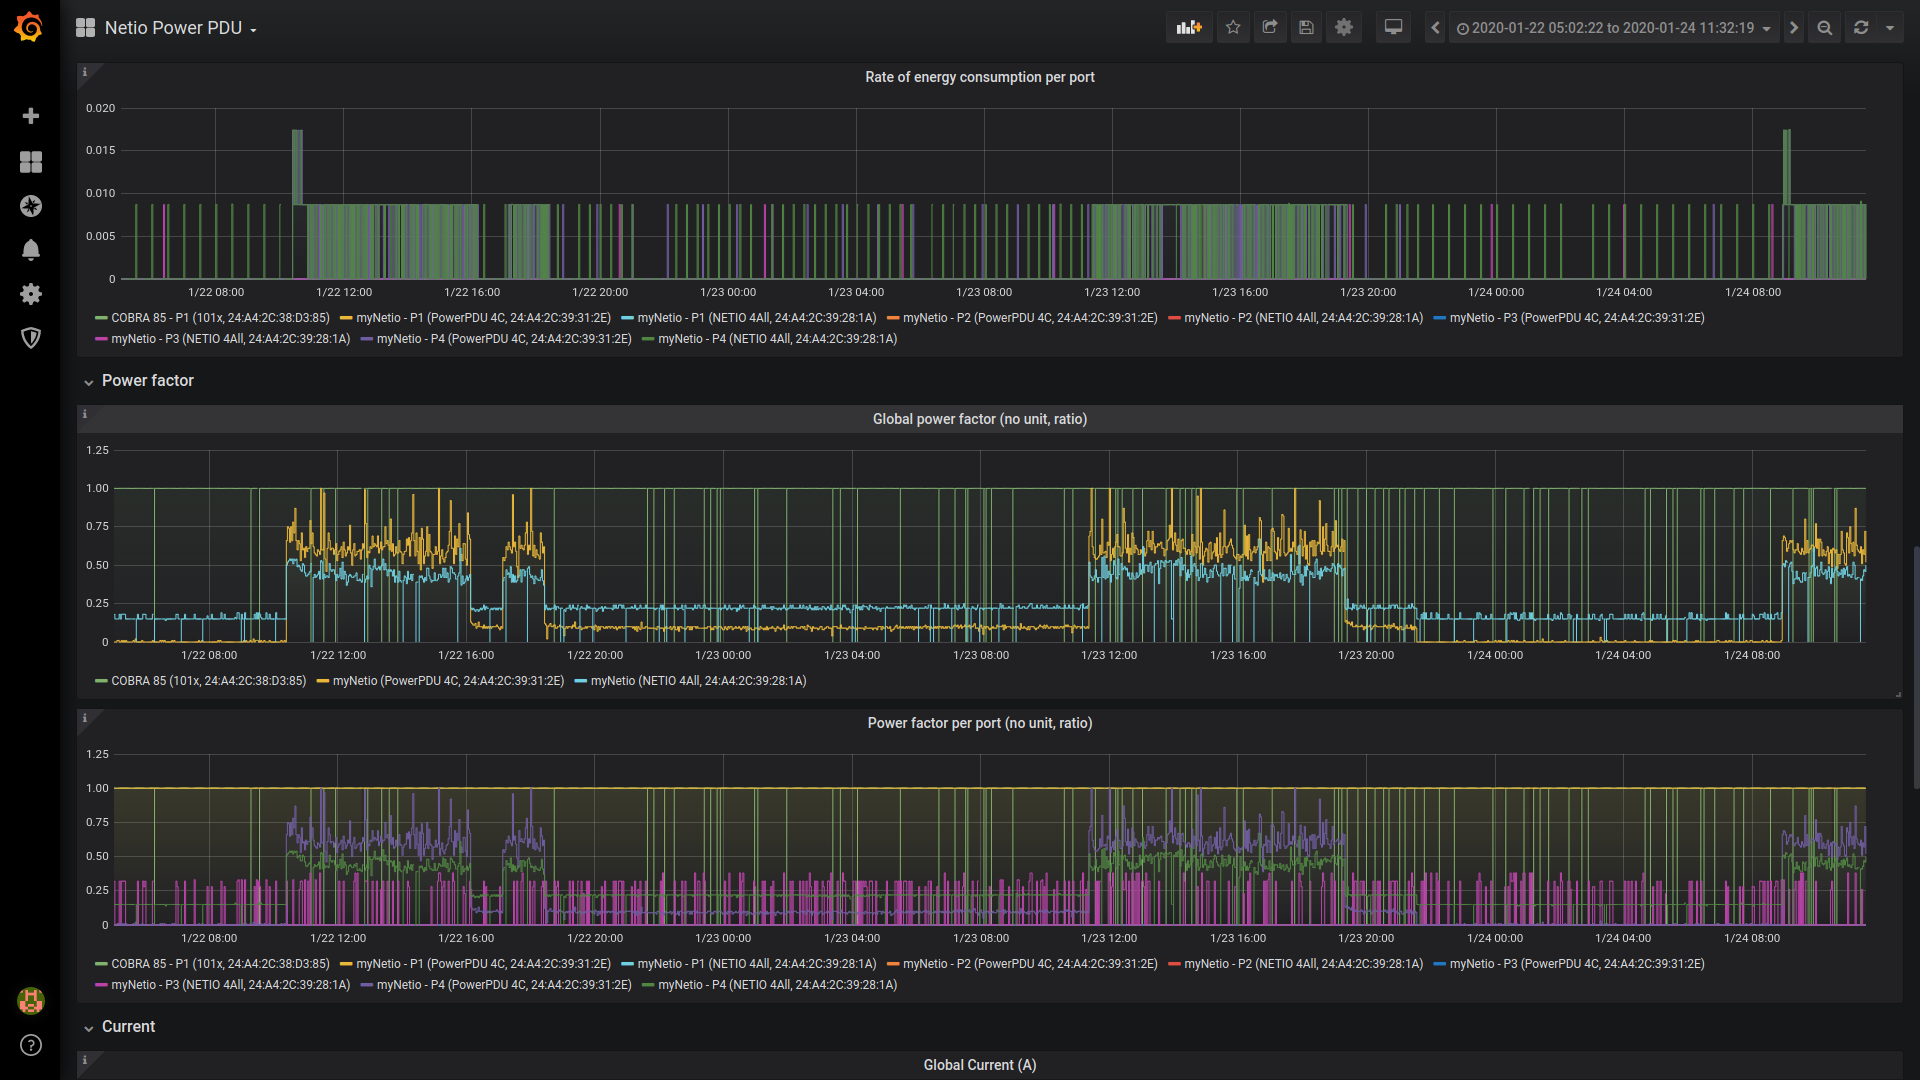
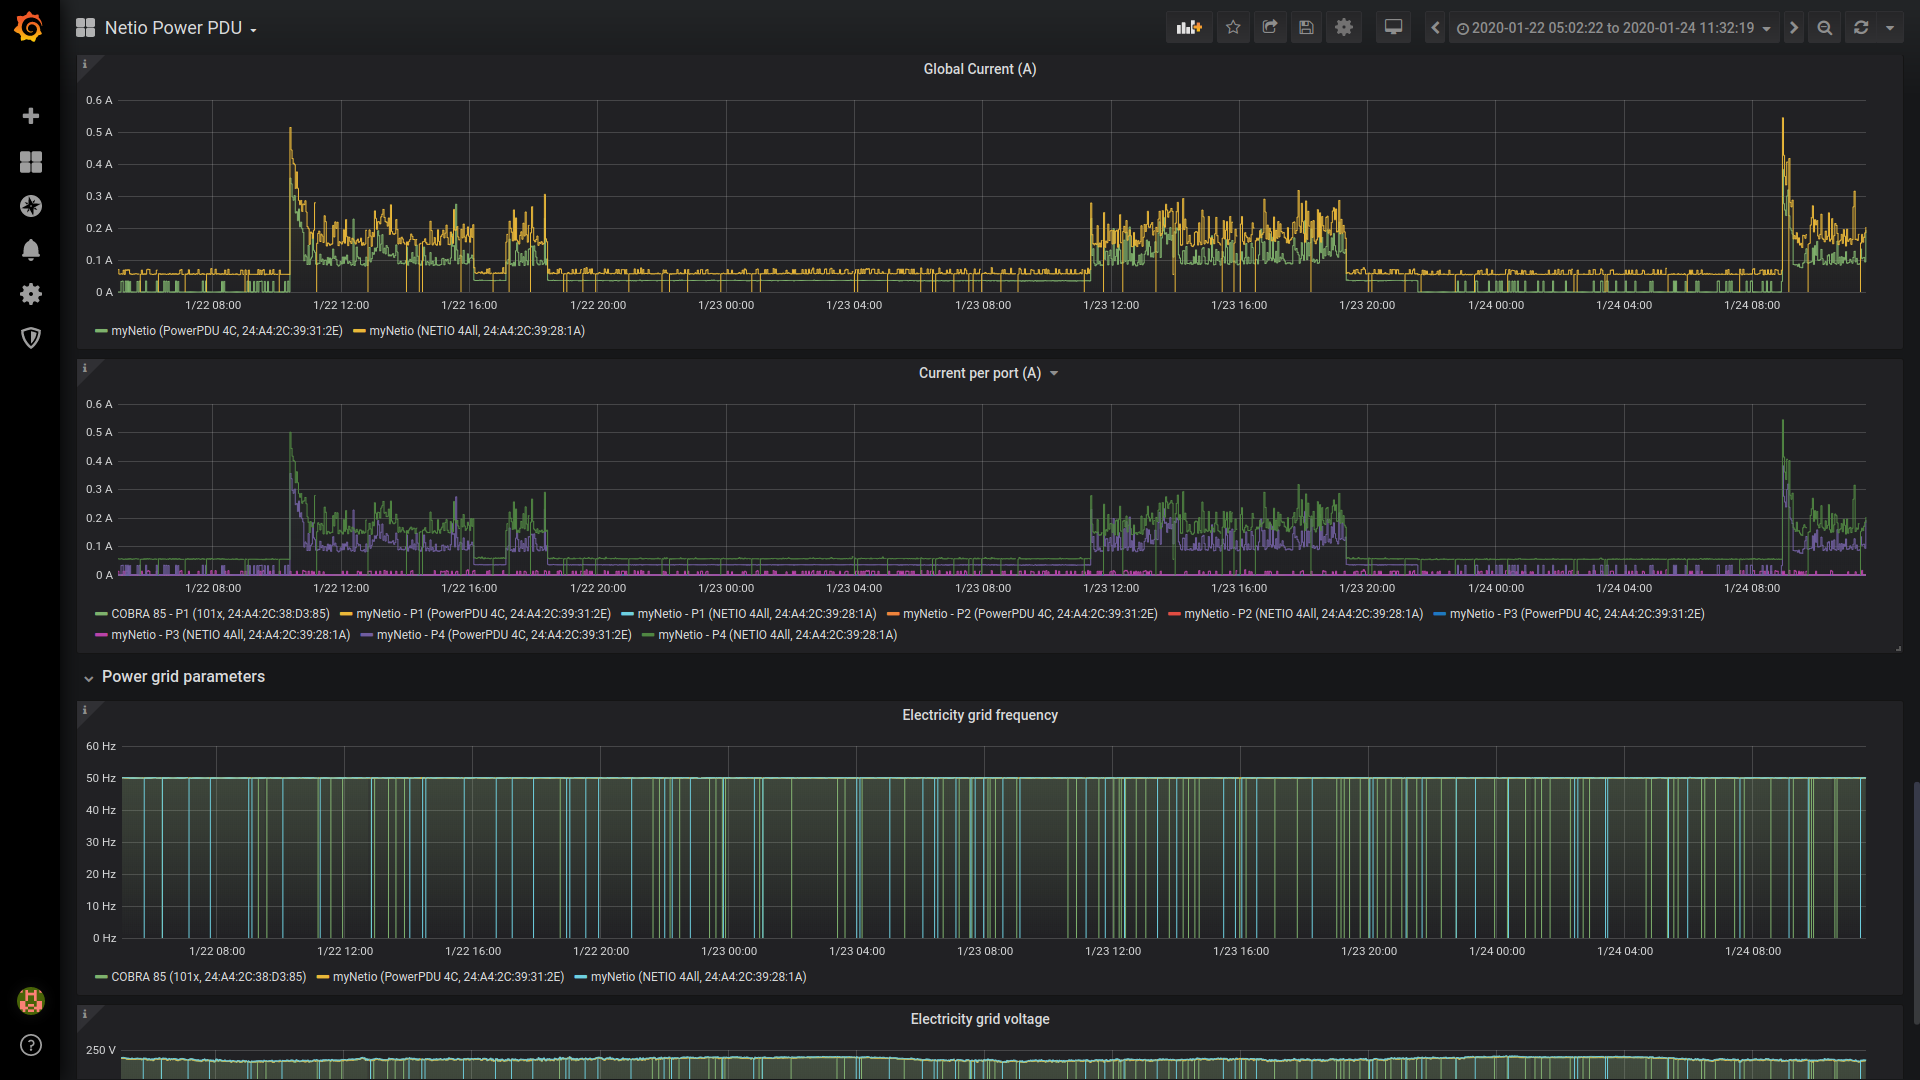
This is a dashboard for metrics generated by netio-exporter (https://github.com/tomsajan/netio-exporter)
Data source config
Collector type:
Collector plugins:
Collector config:
Revisions
Upload an updated version of an exported dashboard.json file from Grafana
| Revision | Description | Created | |
|---|---|---|---|
| Download |