3Scale
Added 3scale 2.9 features
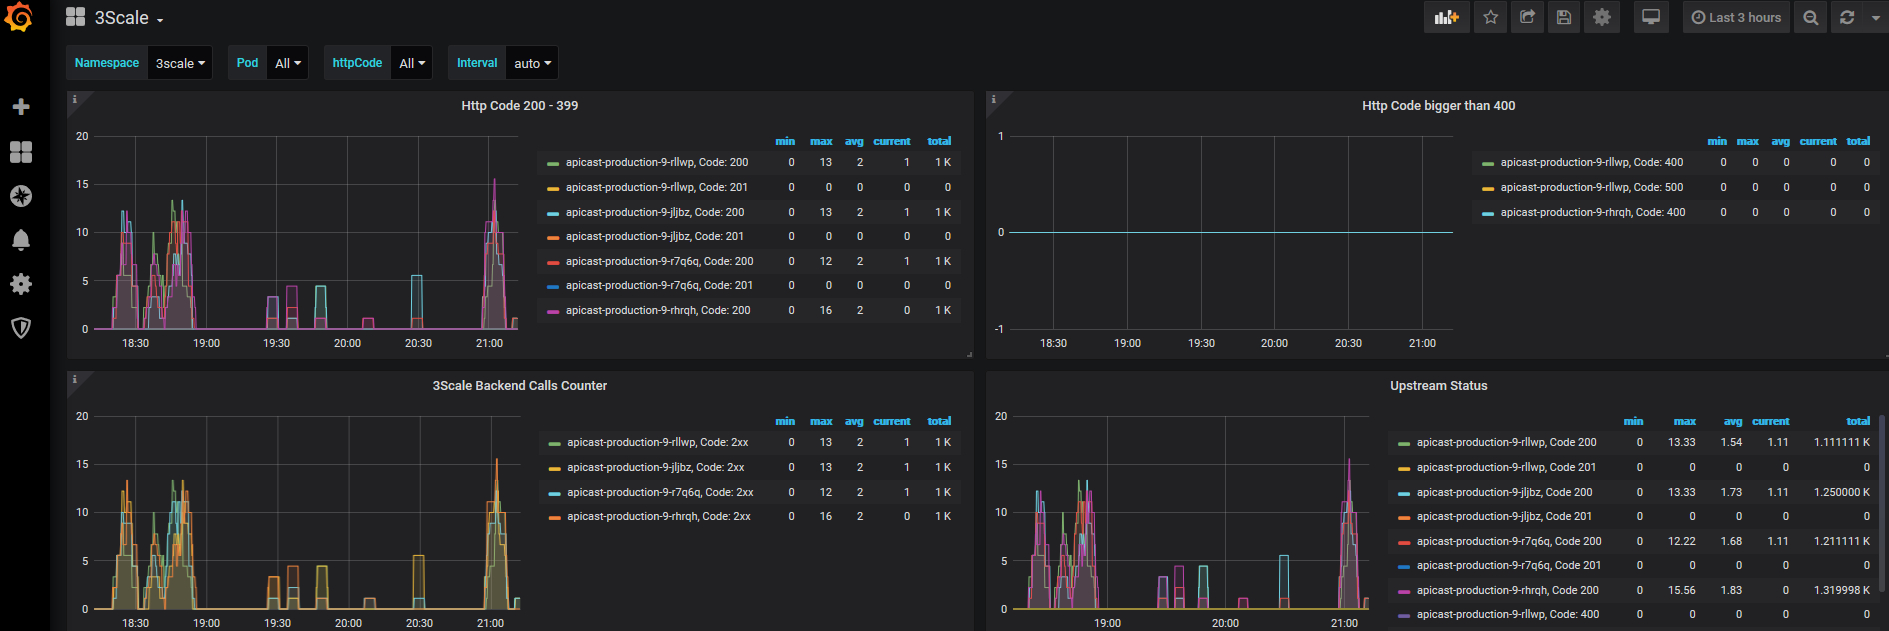
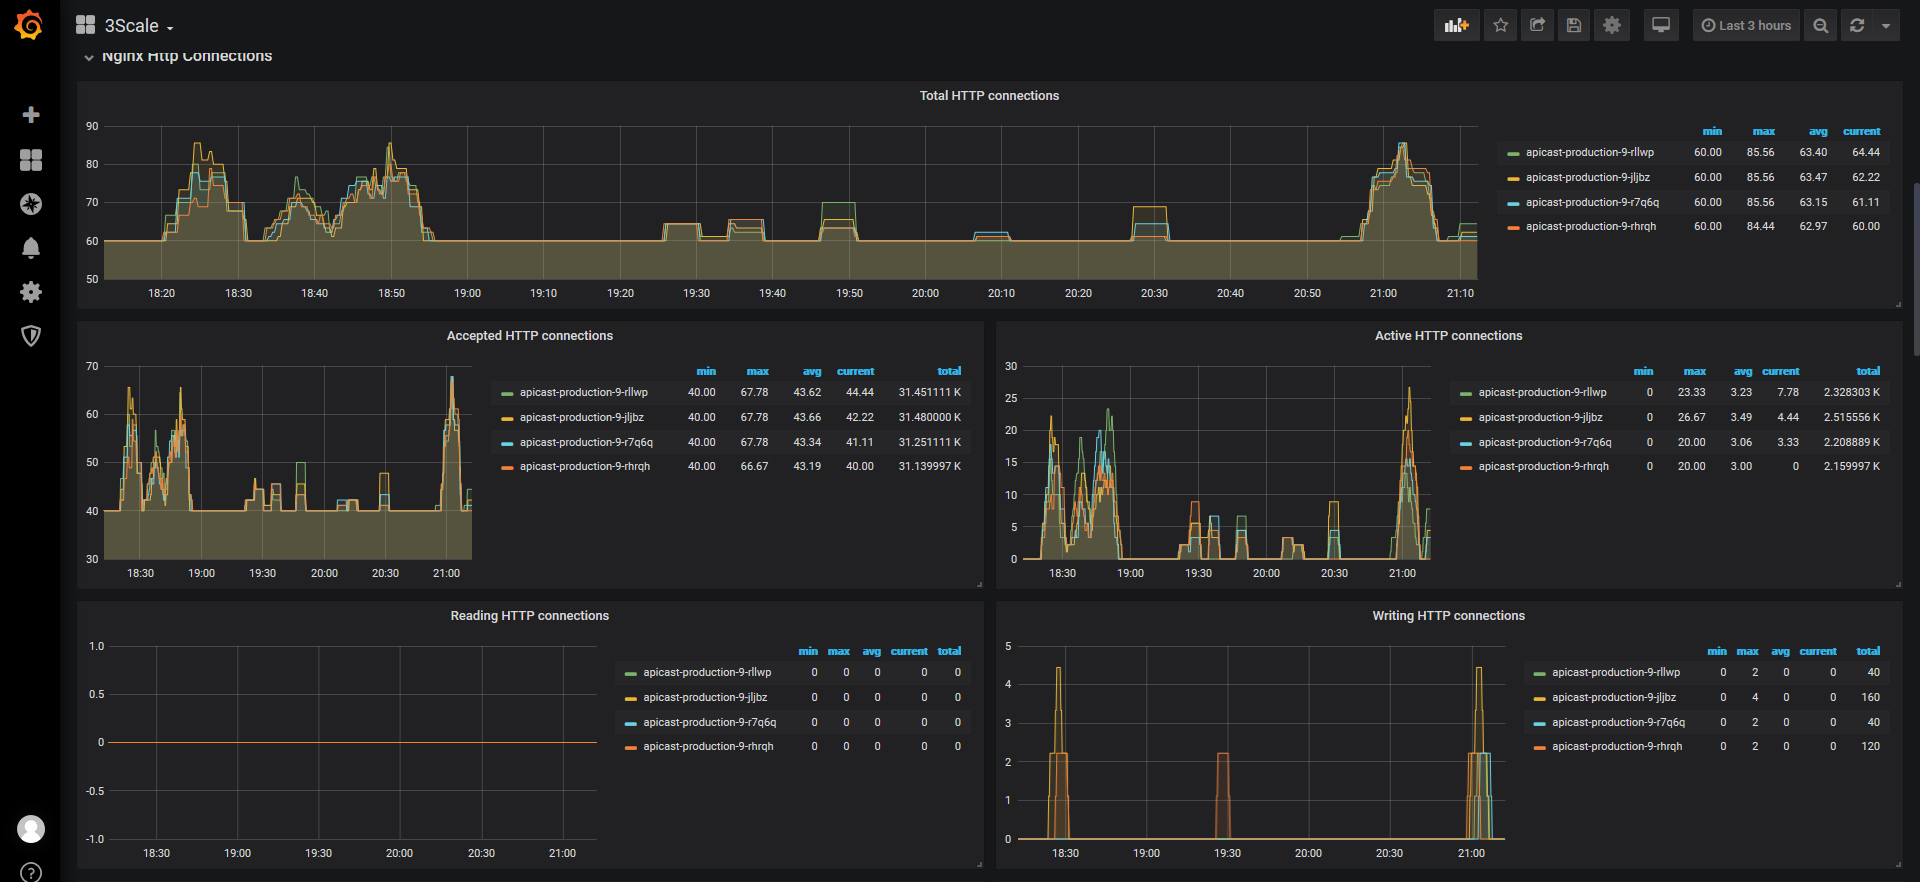
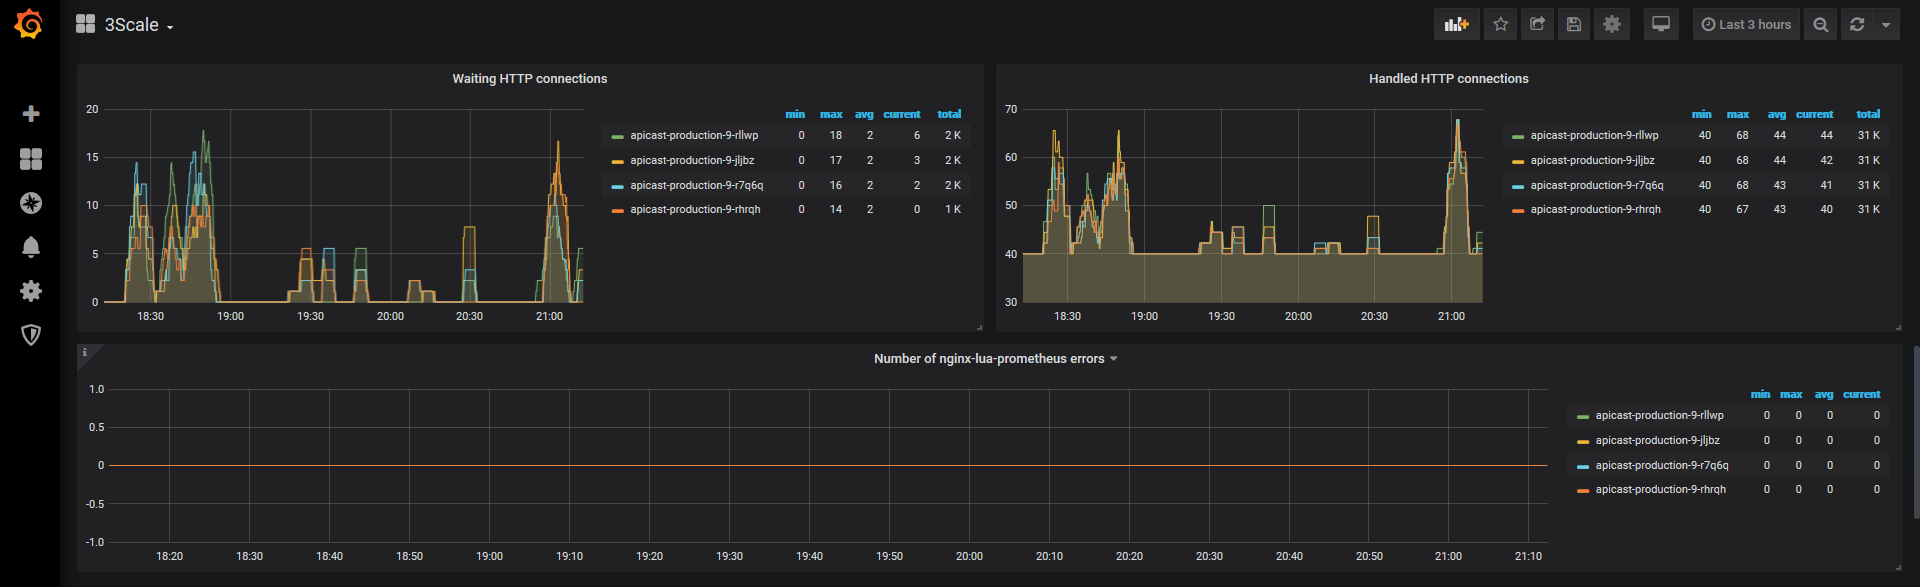
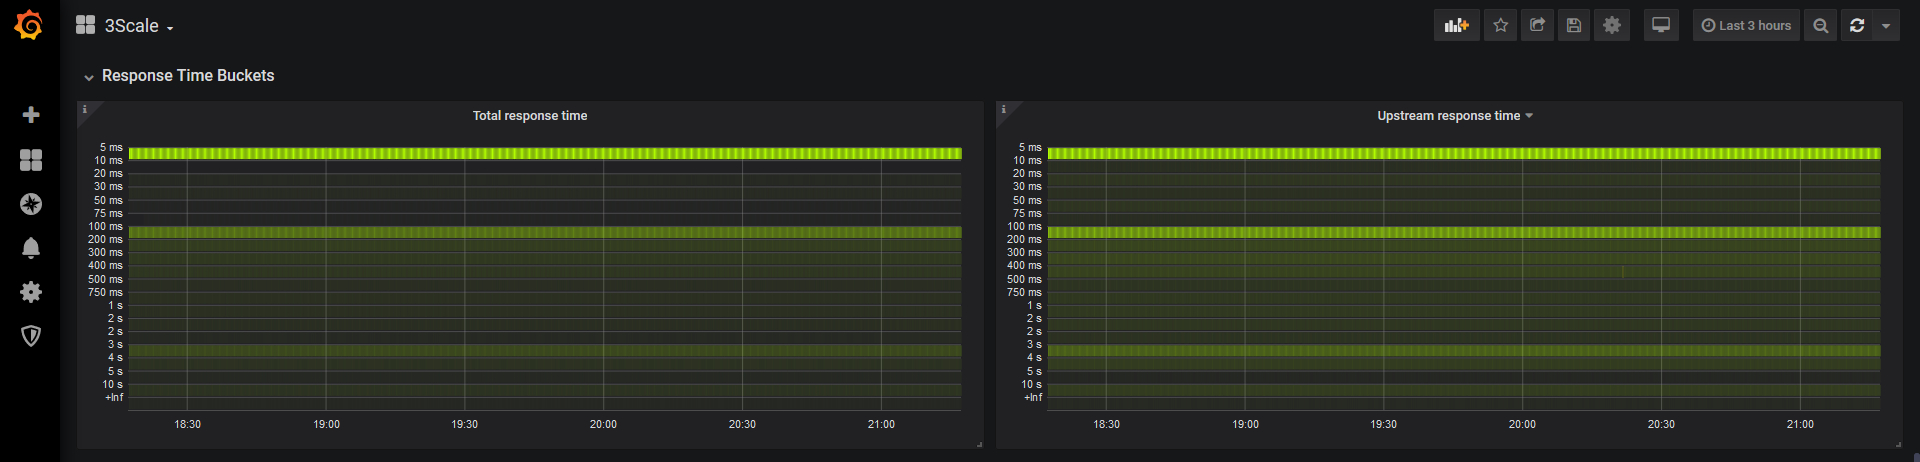
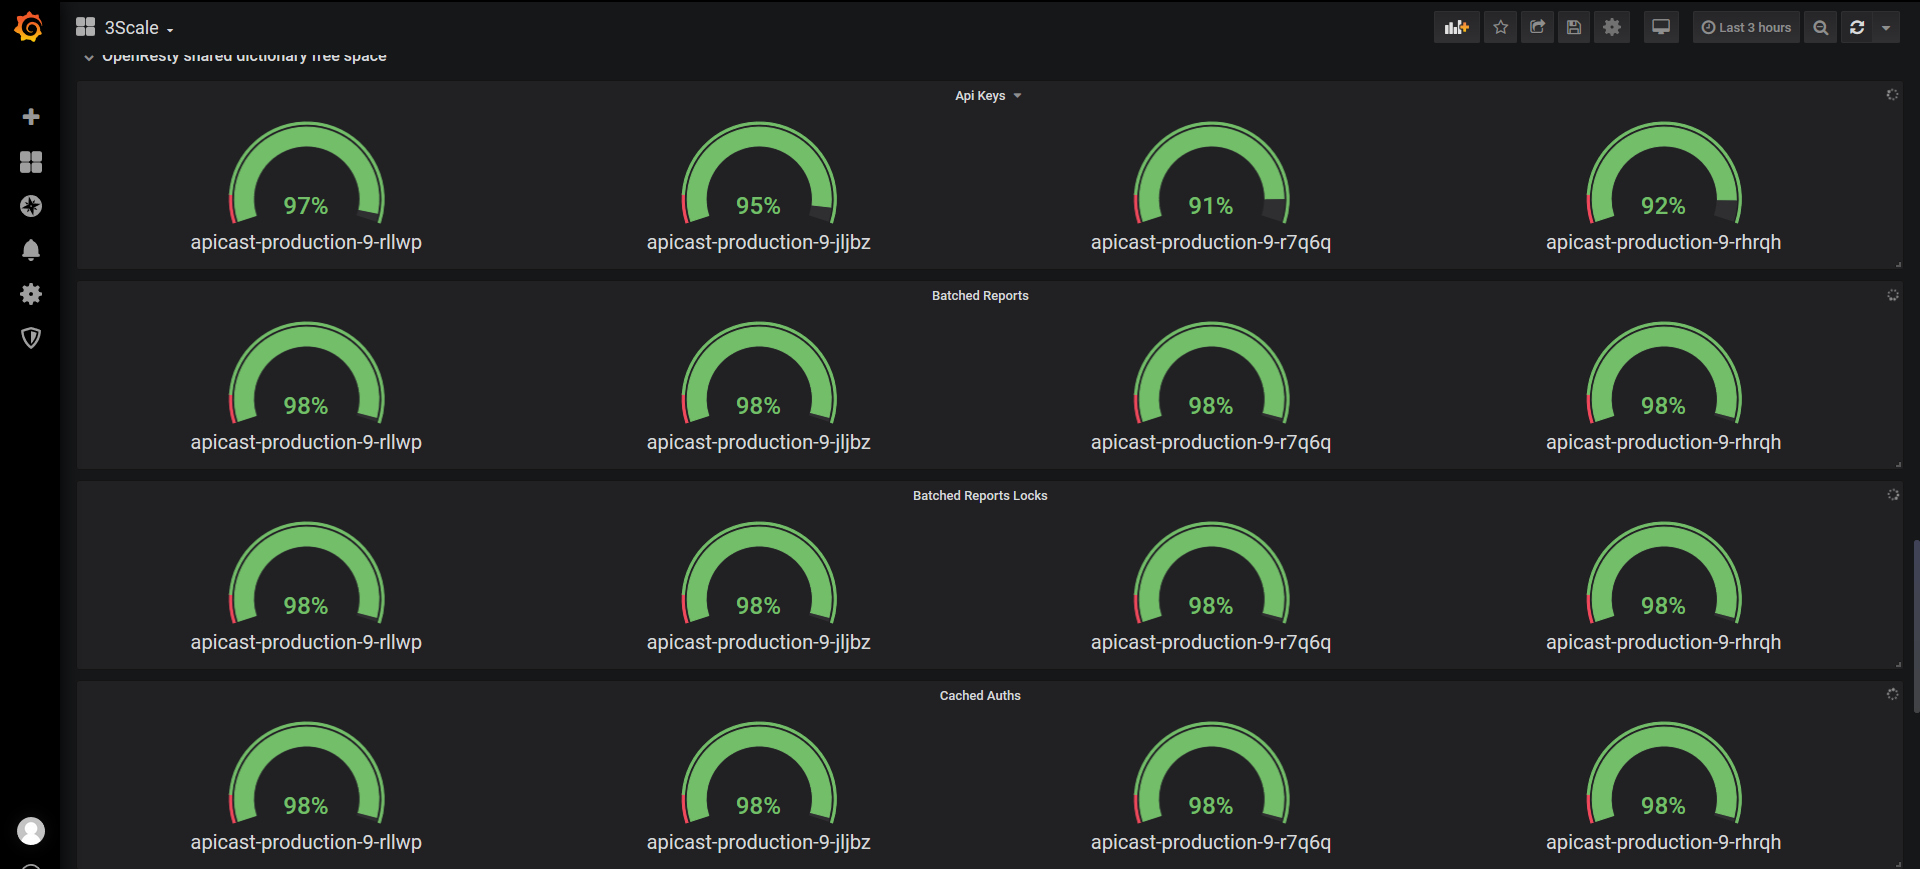
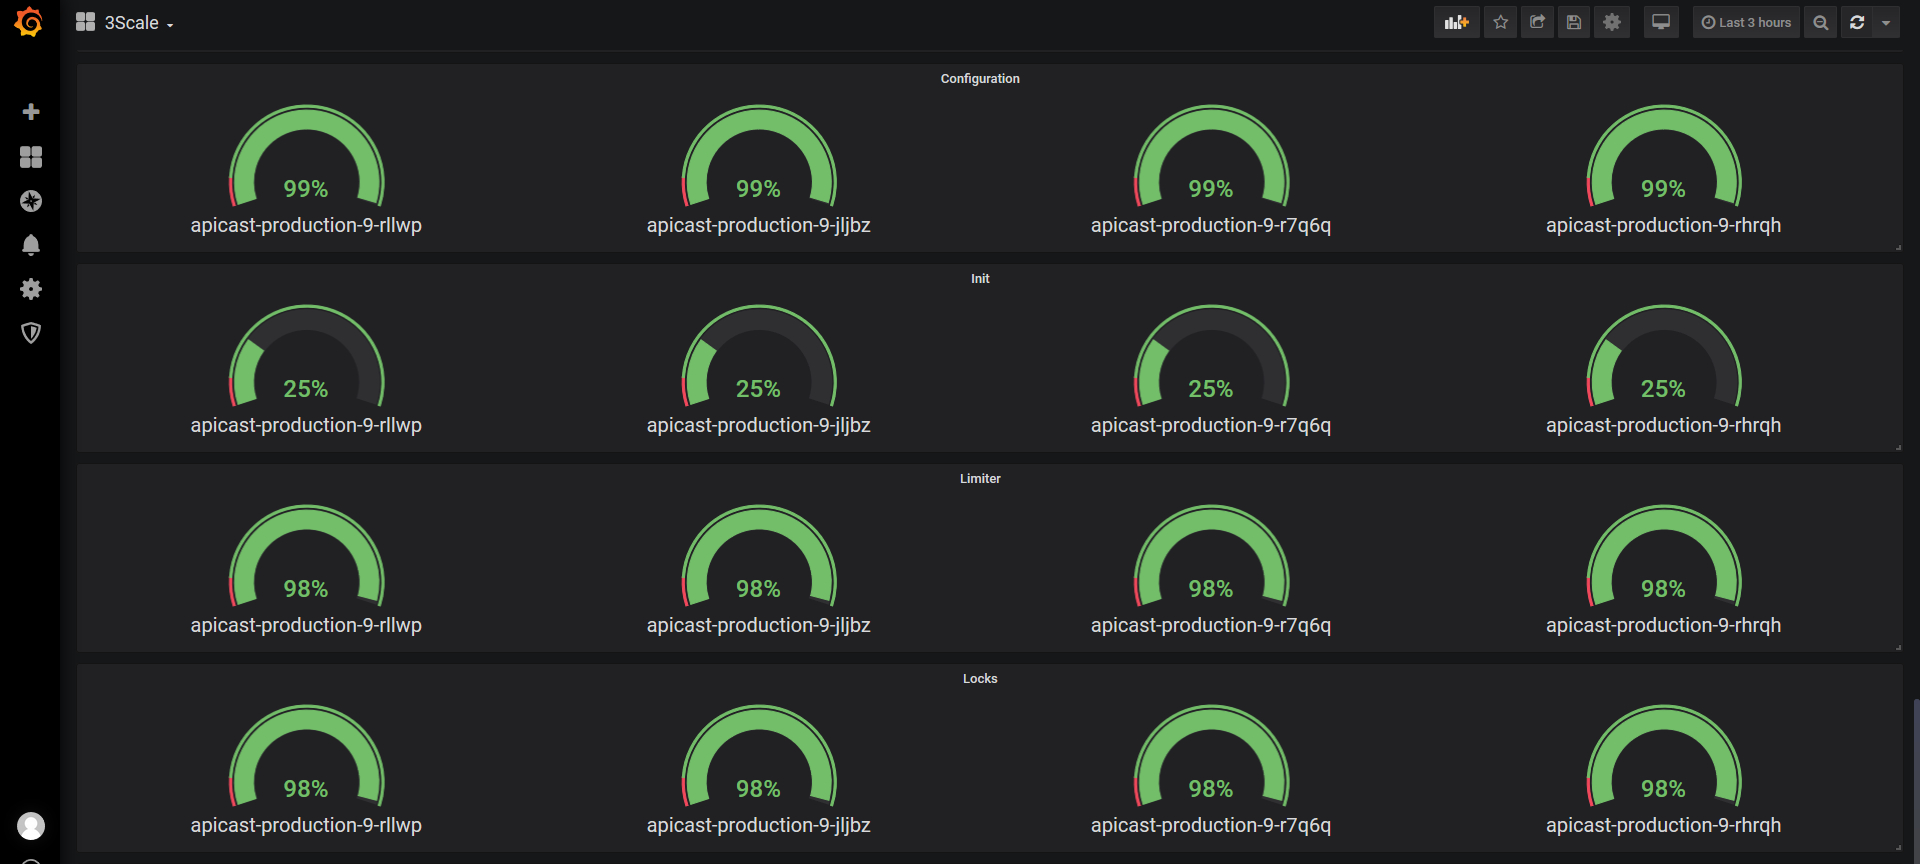
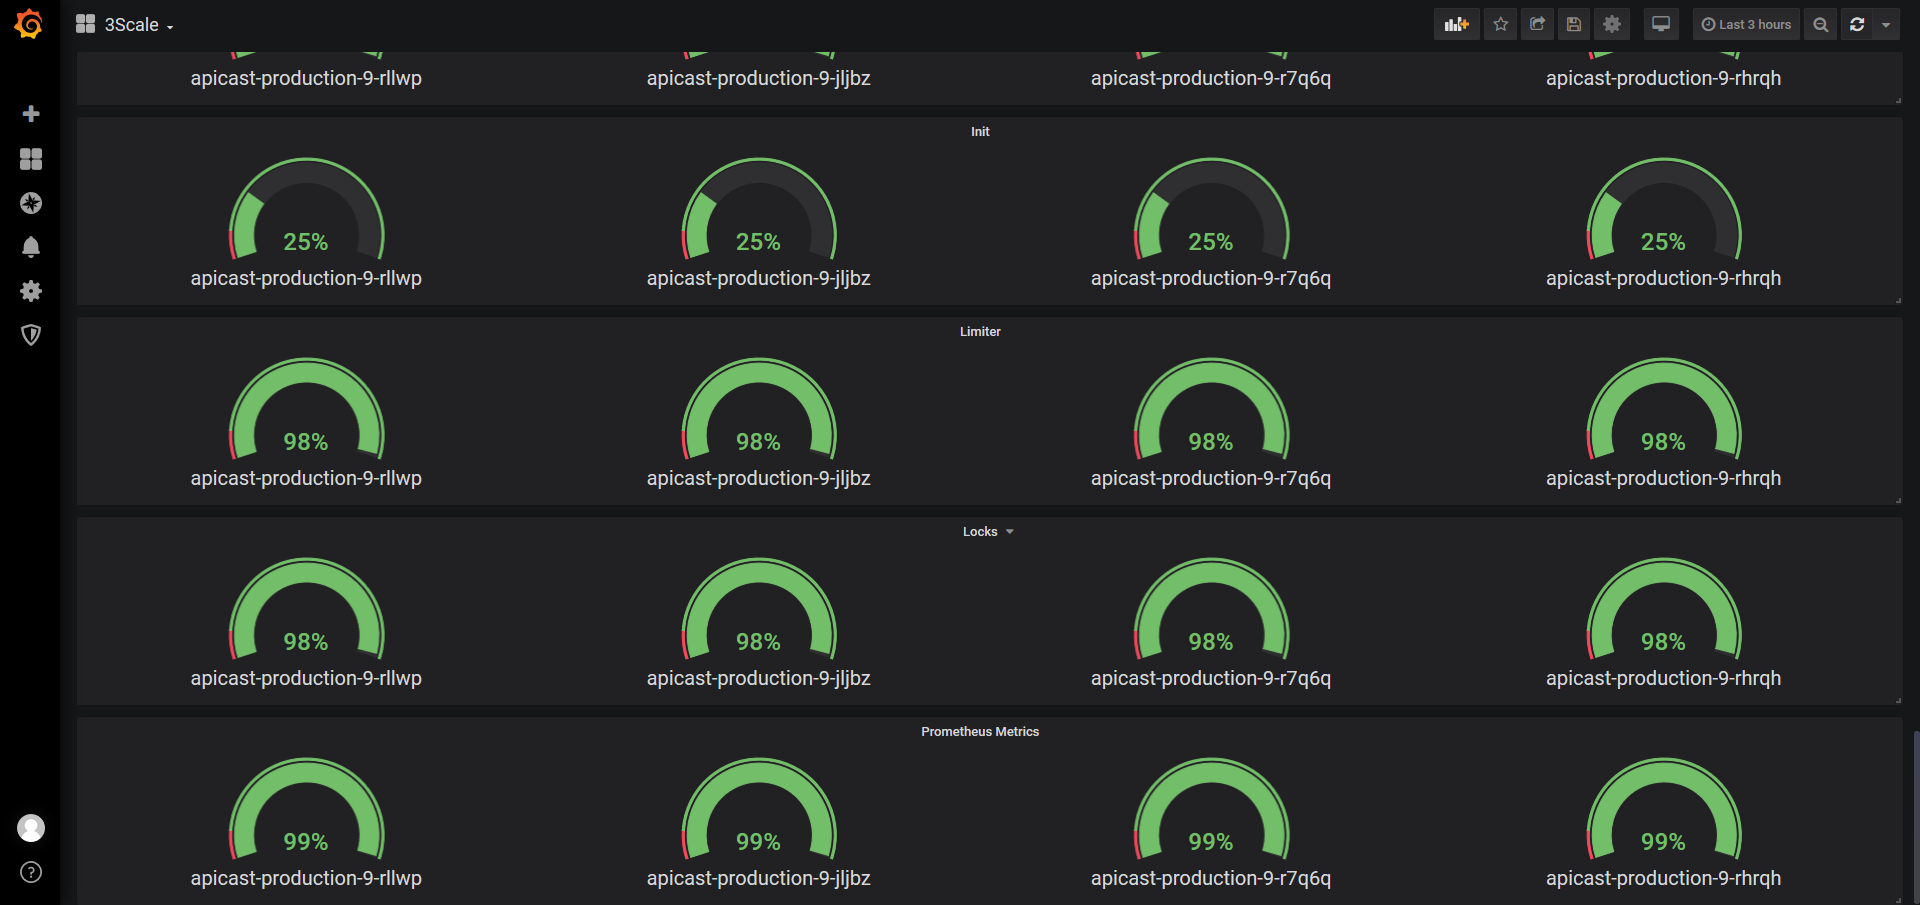
Simple 3scale dashboard to controll nginx and connections status. Everything should already be compleltely dynamic. If something goes wrong with visualization adjust the "namespace" variable. Don't forget to make 3scale metrics available to prometheus (on ocp: servicemonitor, rbac, apicast deploymentconfigs envs, svc prometheus scrape annotation) Each improvemente is welcome.
Data source config
Collector type:
Collector plugins:
Collector config:
Revisions
Upload an updated version of an exported dashboard.json file from Grafana
| Revision | Description | Created | |
|---|---|---|---|
| Download |