Rabbit MQ
This dashboard shows the statistics of a Rabbit MQ installation on a Windows OS monitored by Zabbix
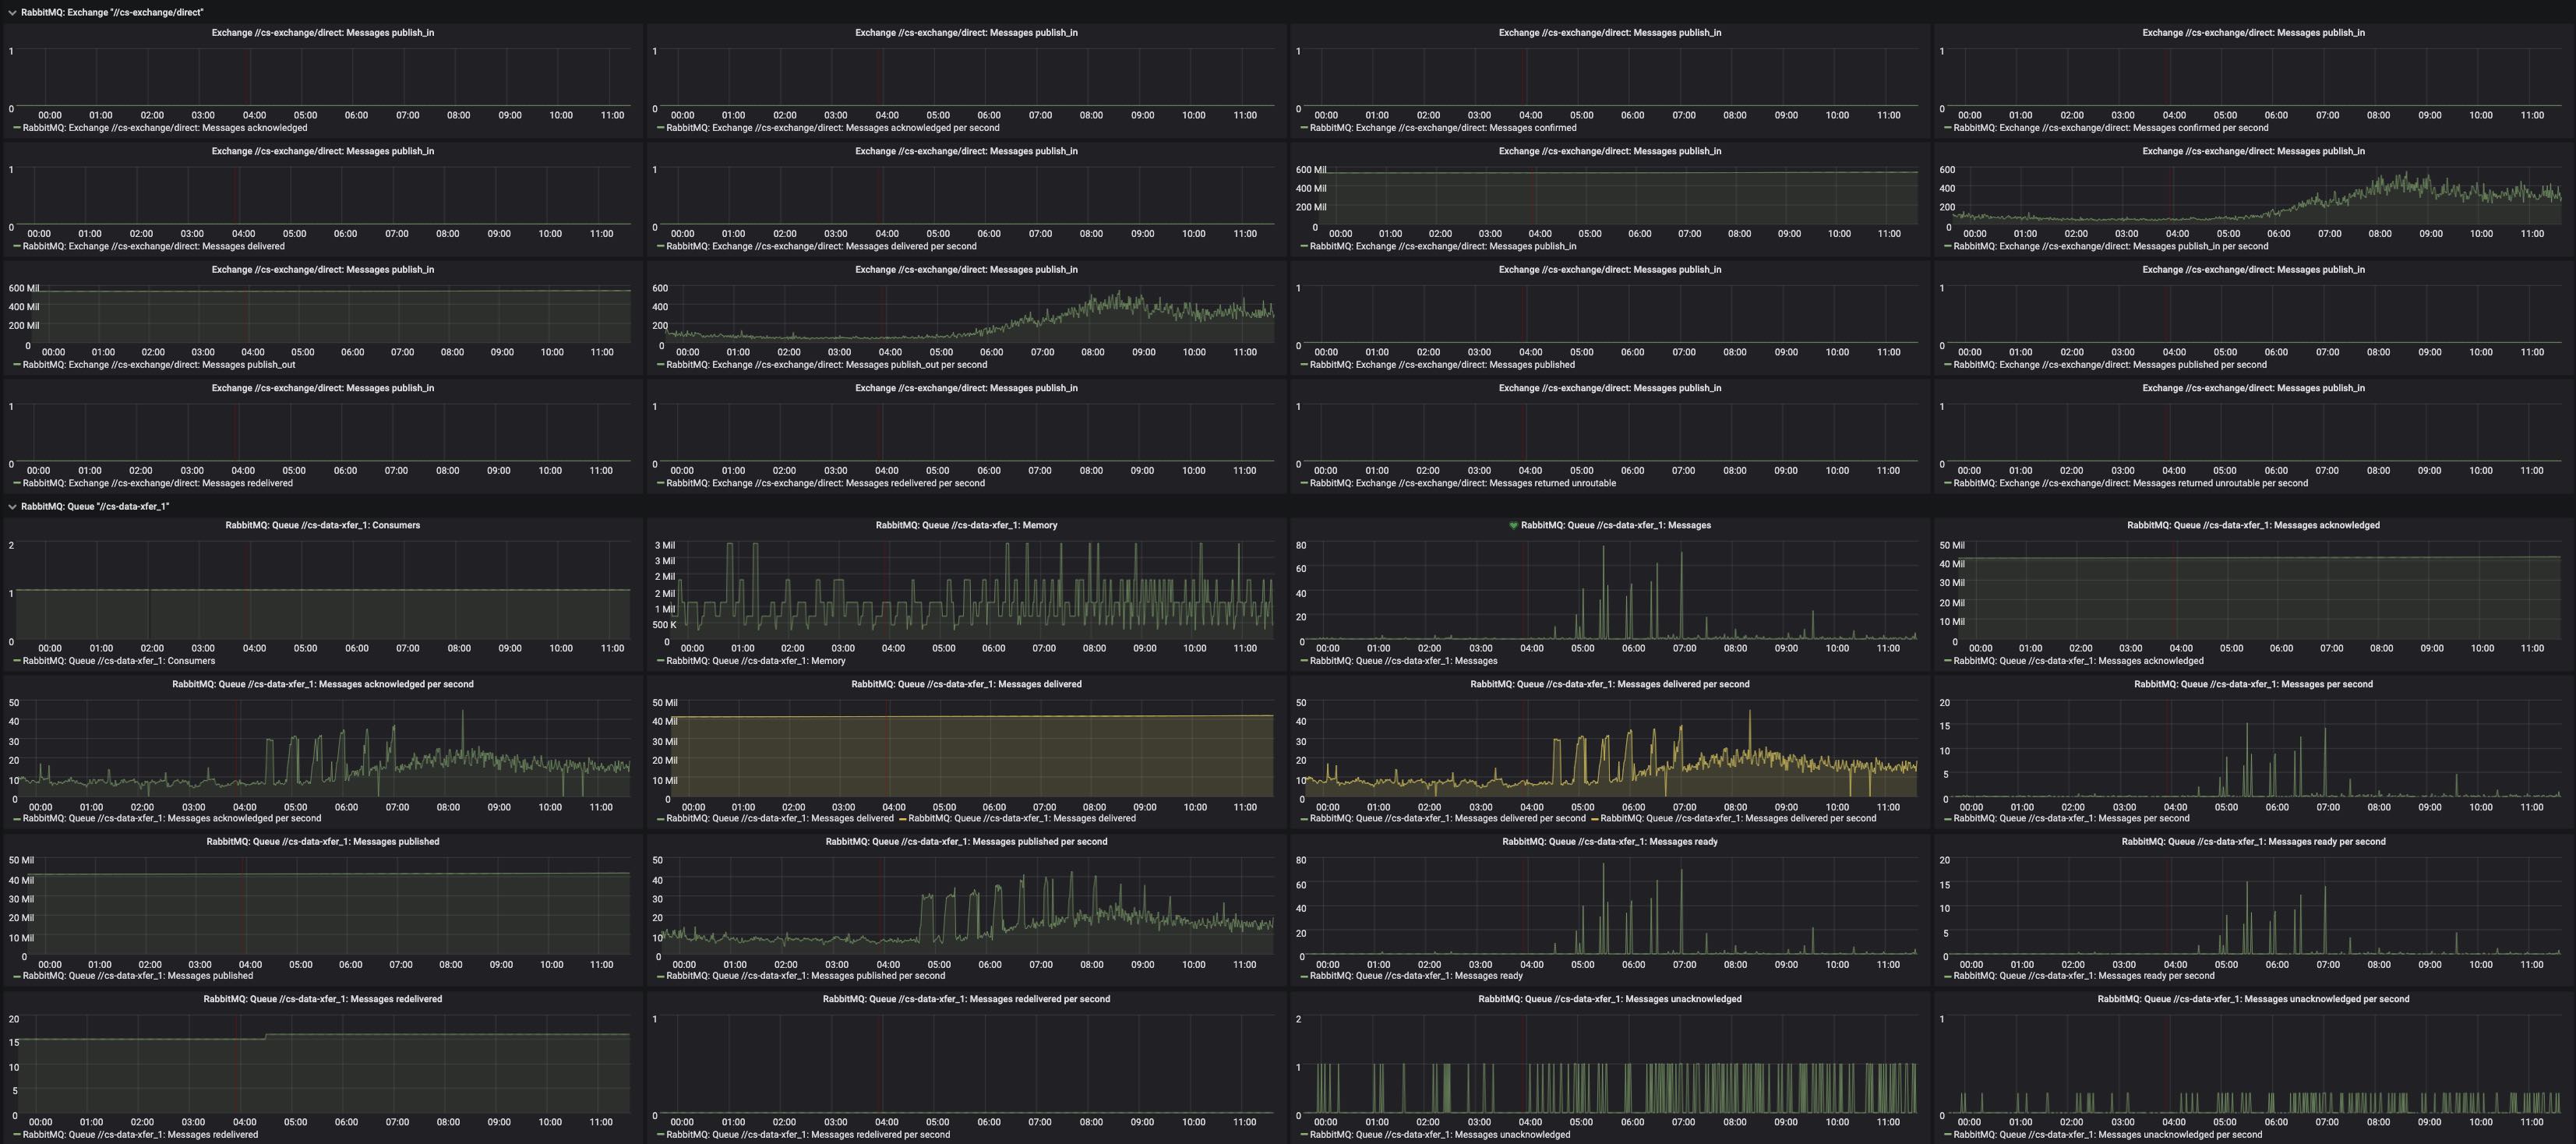
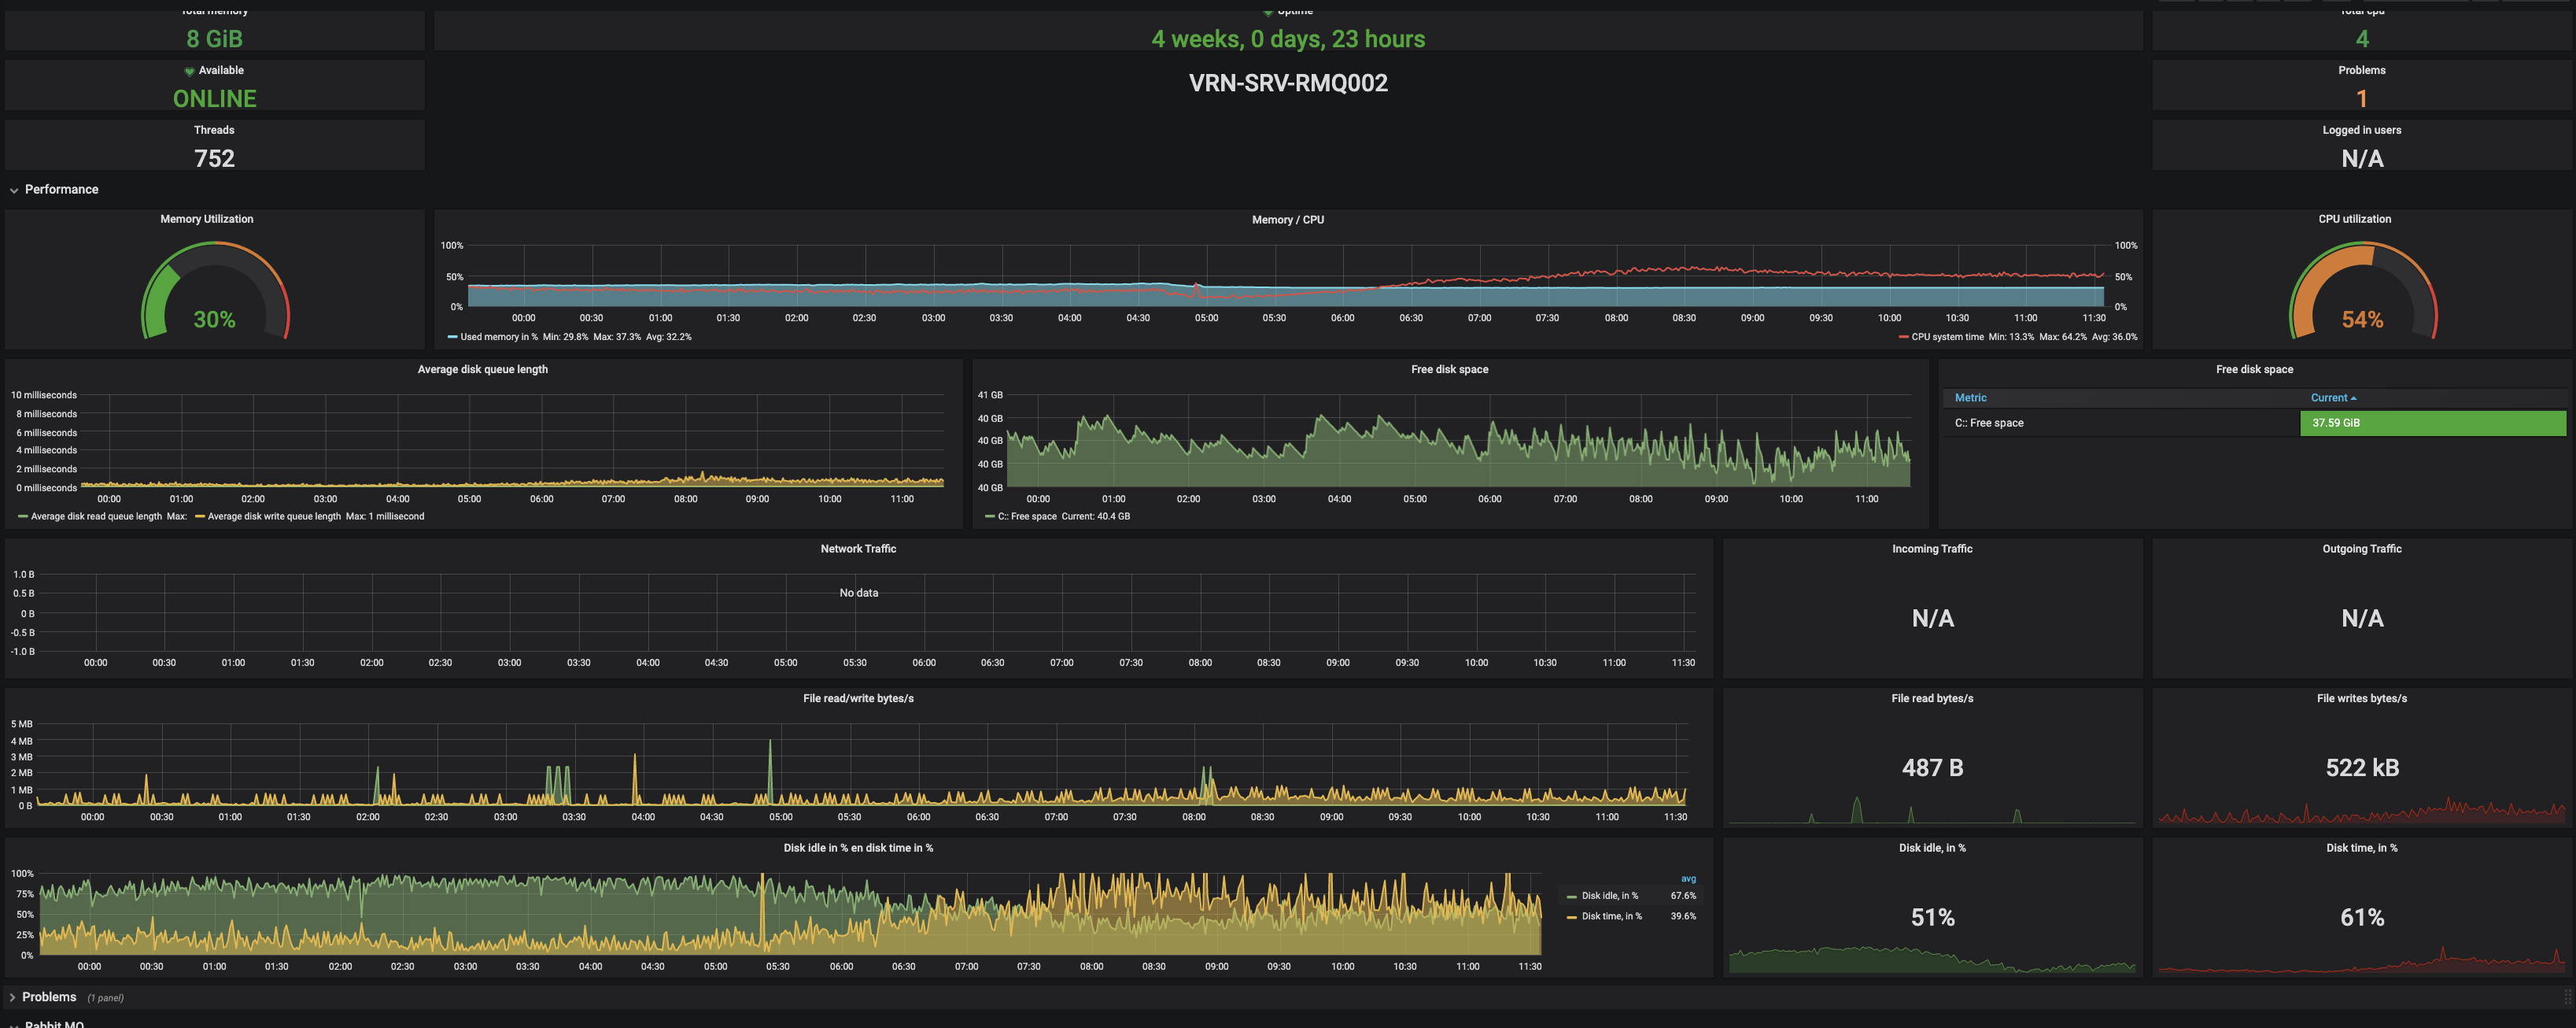
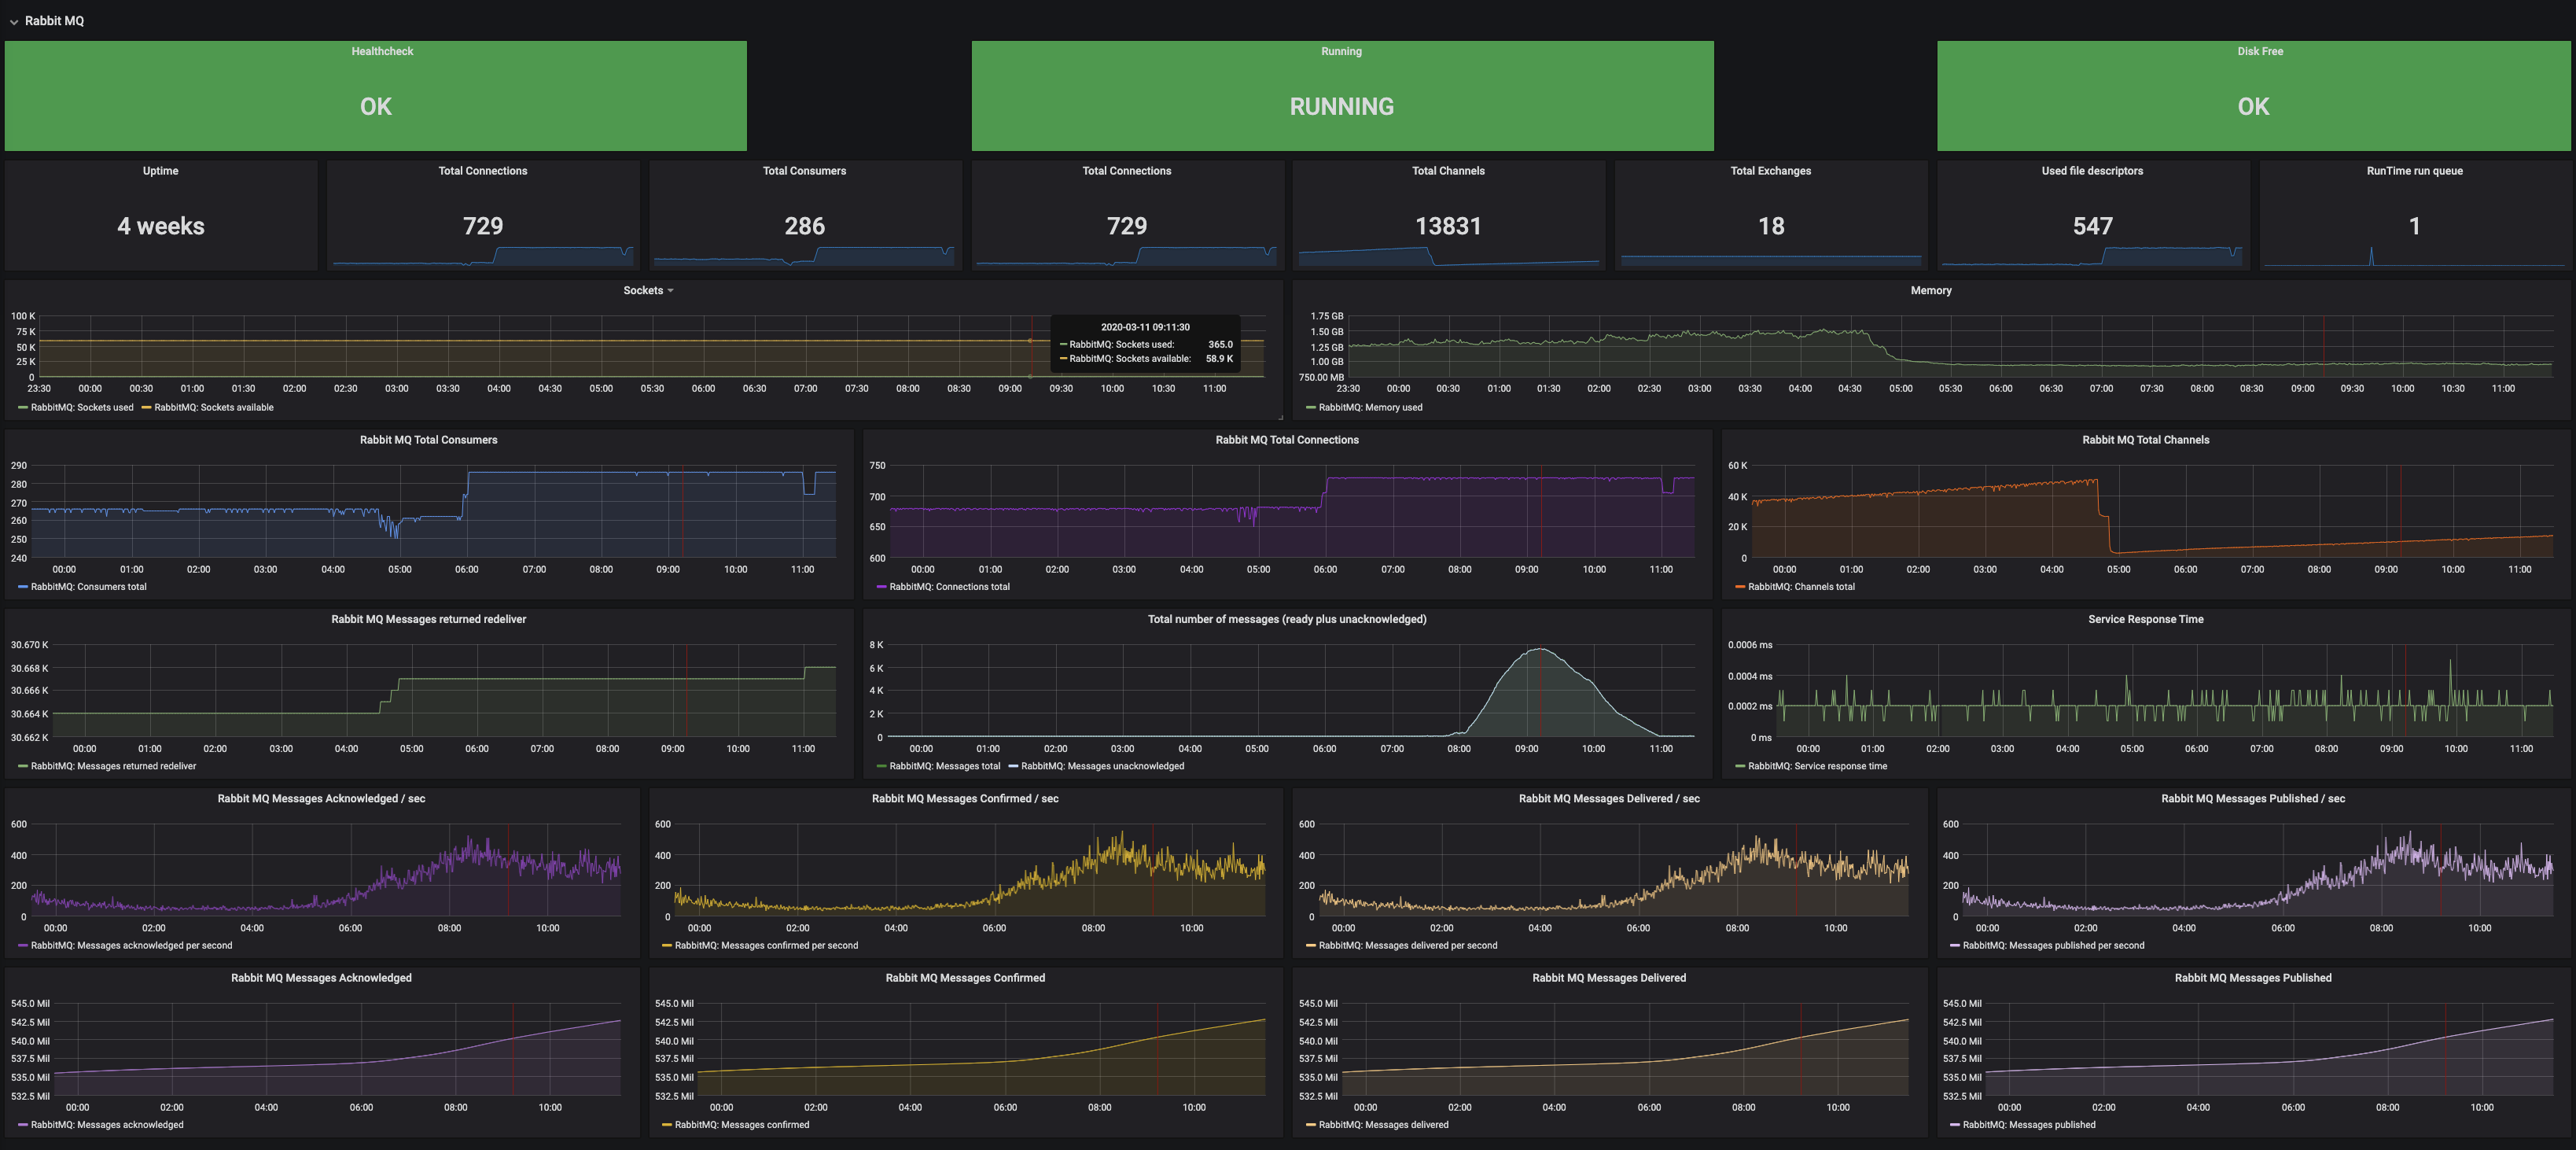
The Rabbit MQ dashboard uses the alexanderzobnin-zabbix-datasource data source to create a Grafana dashboard with the alexanderzobnin-zabbix-triggers-panel, gauge, graph, singlestat and table panels.
Data source config
Collector type:
Collector plugins:
Collector config:
Revisions
Upload an updated version of an exported dashboard.json file from Grafana
| Revision | Description | Created | |
|---|---|---|---|
| Download |
IBM MQ
Easily monitor your deployment of IBM MQ, a mesmsaging queue software, with Grafana Cloud's out-of-the-box monitoring solution.
Learn more