WeaveNet
WeaveNet metrics. It was made on top of the weavenet prometheus metrics. Please check this for more details https://www.weave.works/docs/net/latest/tasks/manage/metrics
Weave-net monitoring dashboard.
Weave-net emits prometheus metrics which is the backend of this dashboard. https://www.weave.works/docs/net/latest/tasks/manage/metrics/
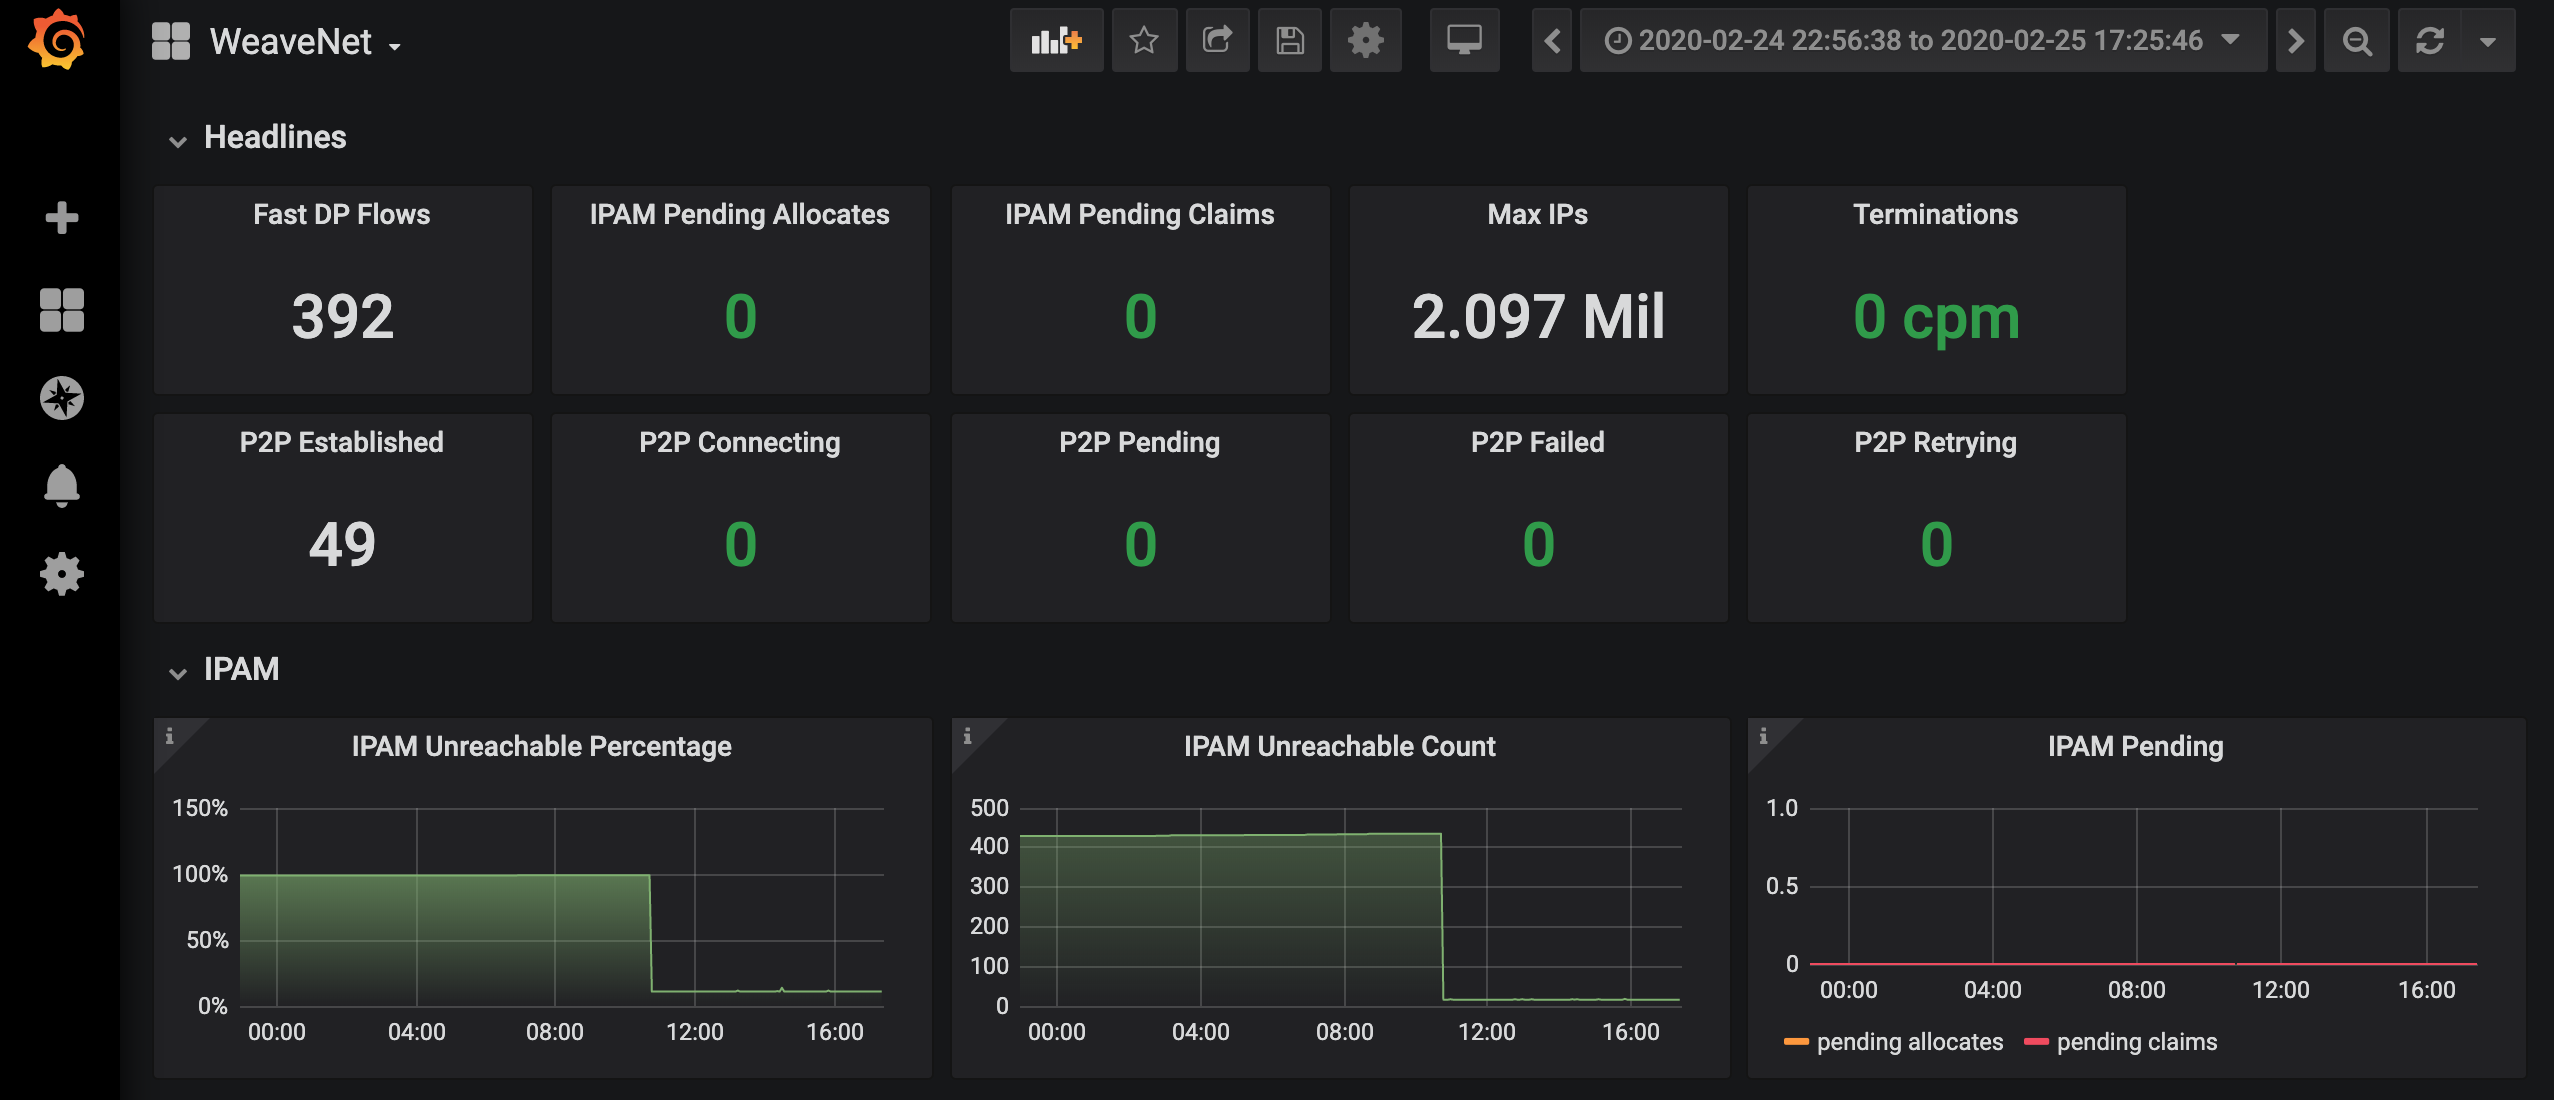
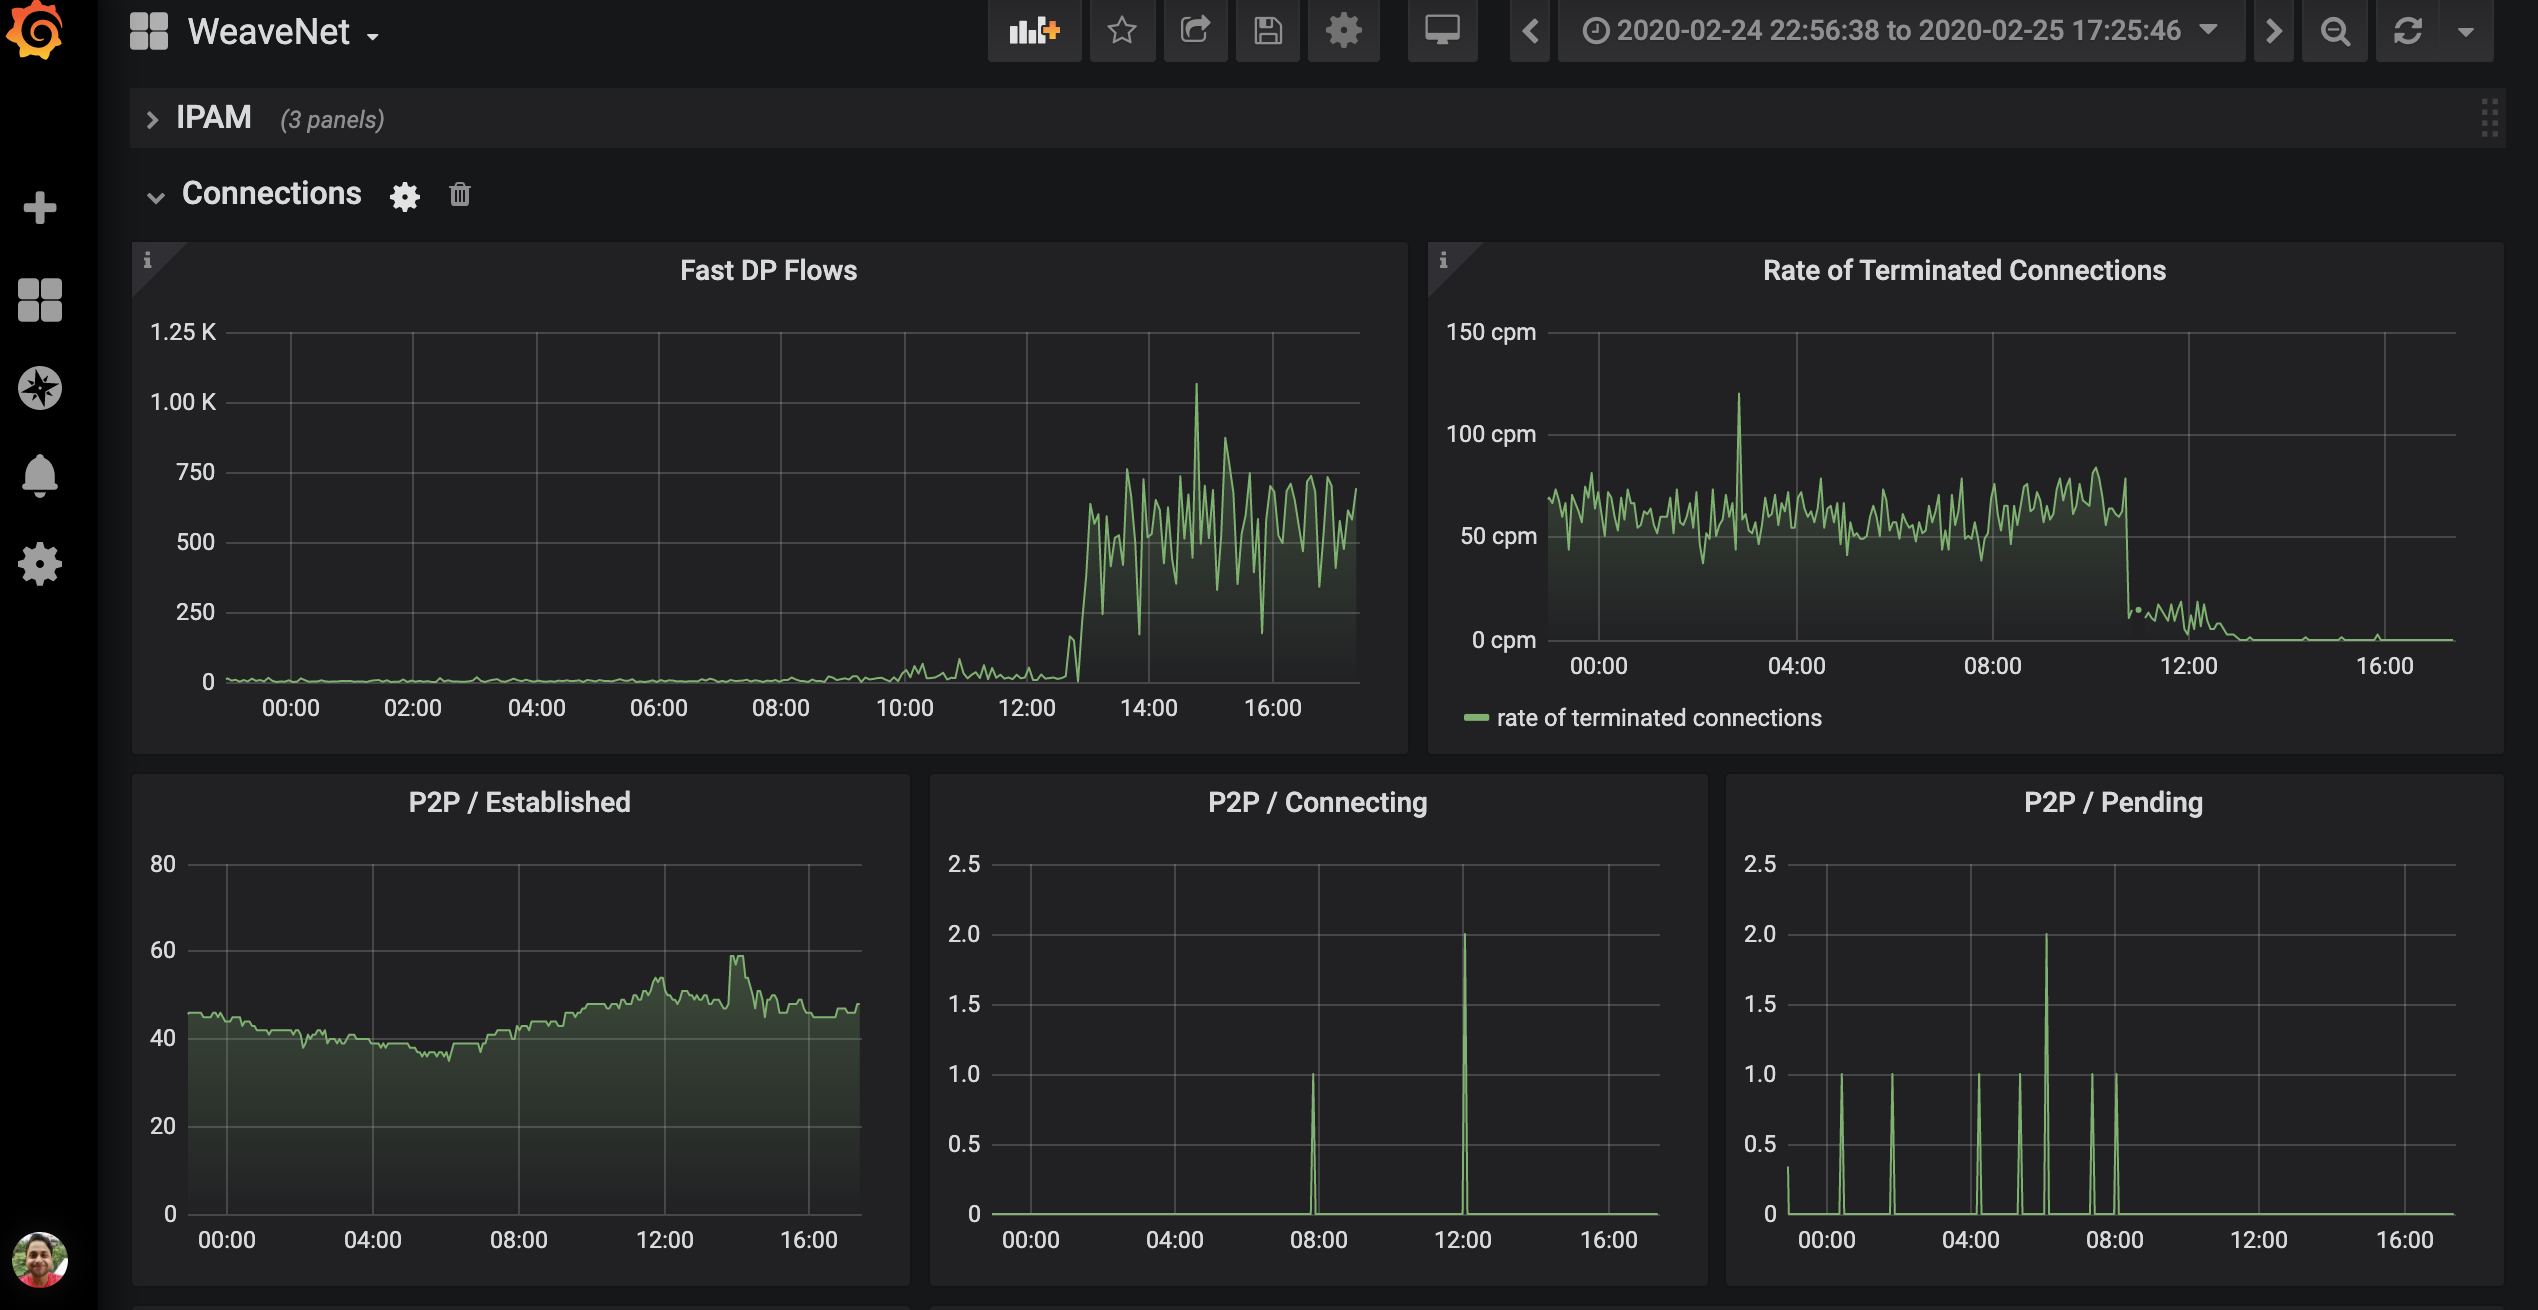
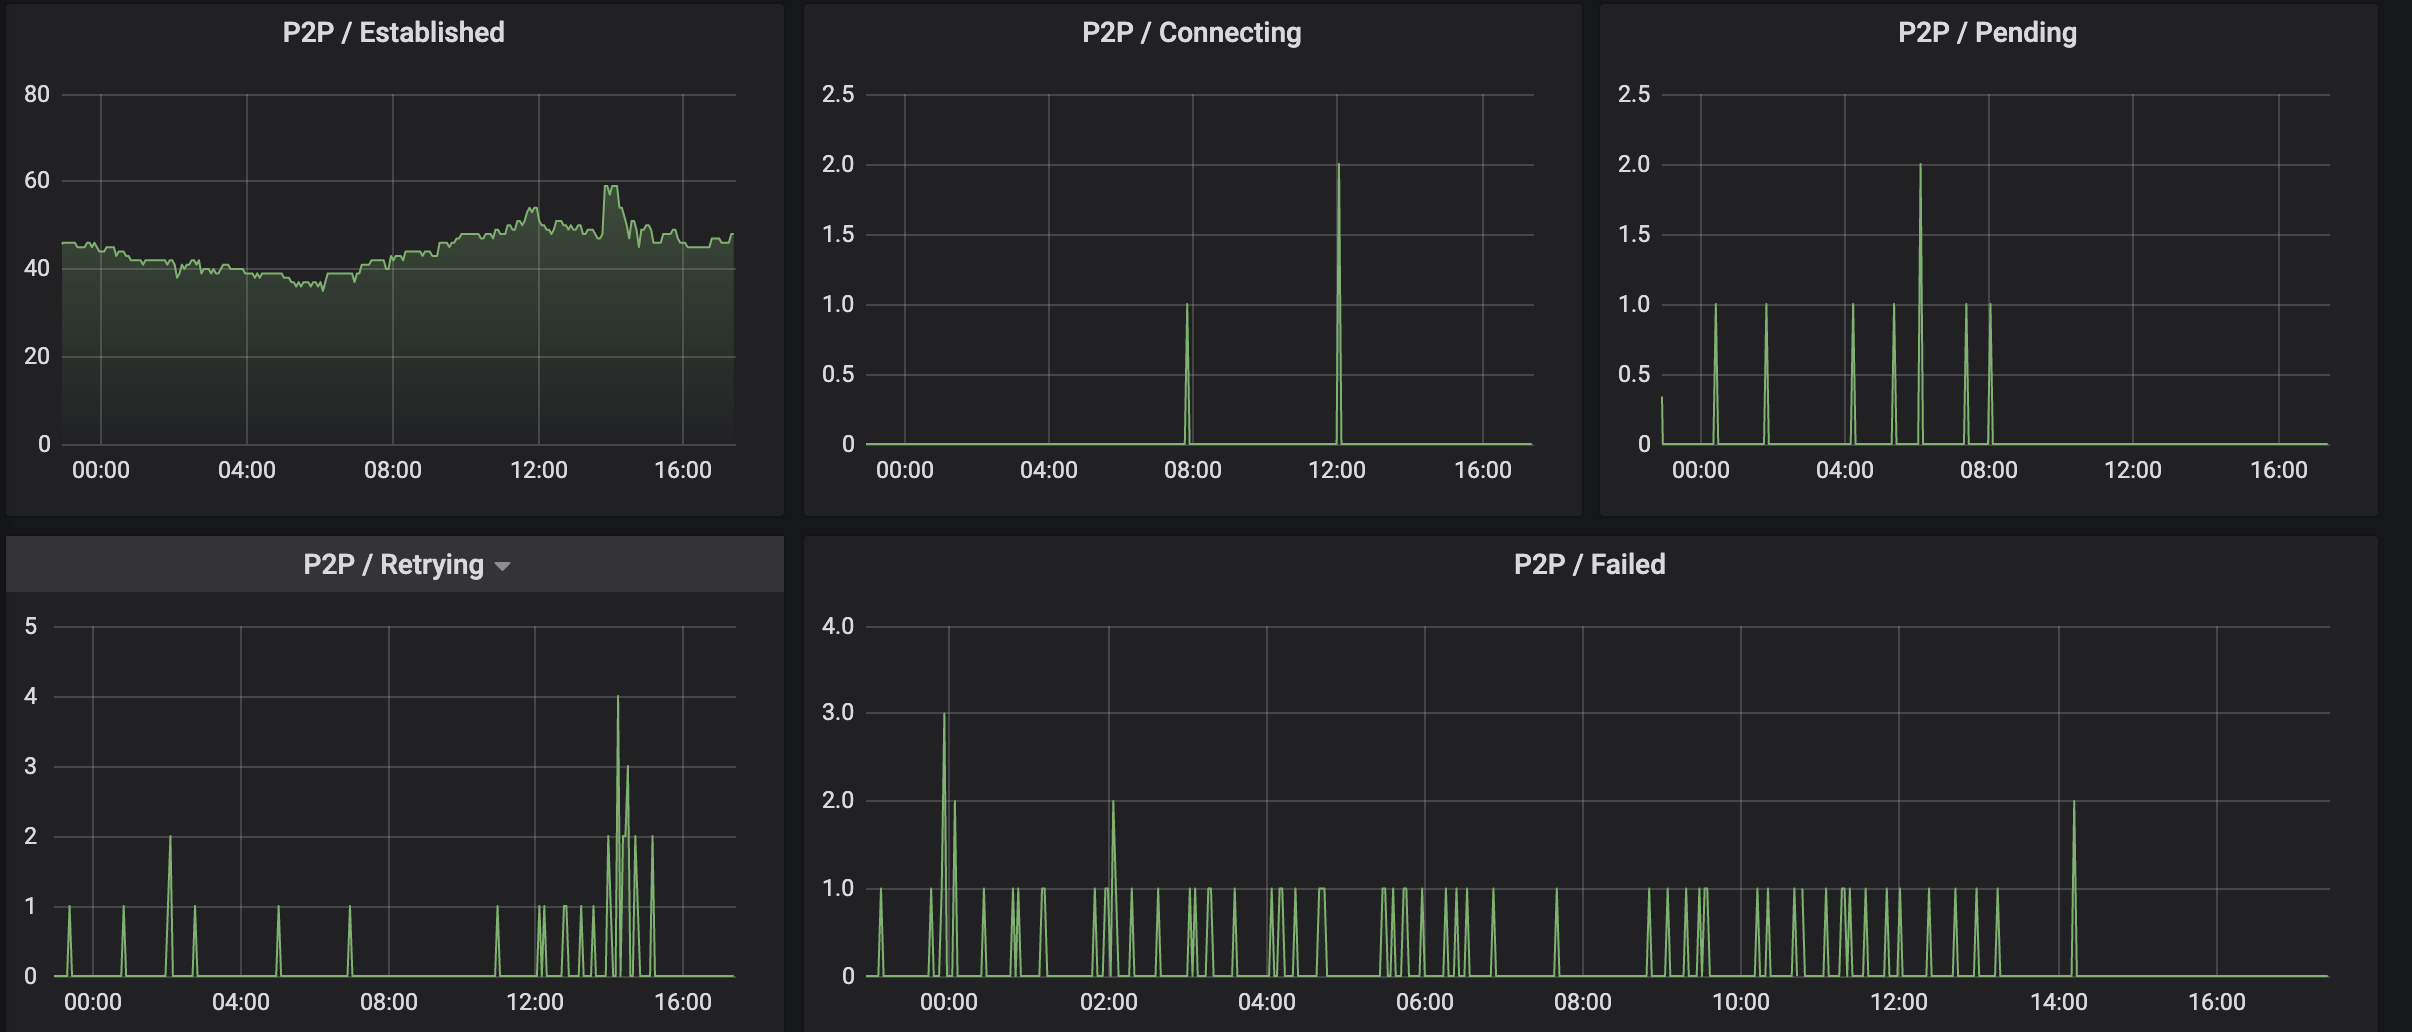
The dashboard is categorized under three things
- Headlines: Current metrics for the weave-net.
- IPAM: All the IPAM metric dashboards.
- Connections: All the peer to peer connection dashboards and weave flows dashboard.
For Weave Cluster dashboard which gives a view of weave net at a cluster level. Visit here: https://grafana.com/grafana/dashboards/11804
Data source config
Collector config:
Upload an updated version of an exported dashboard.json file from Grafana
| Revision | Description | Created | |
|---|---|---|---|
| Download |


