Octopus Deploy
Octopus Deploy reporting on projects and tasks
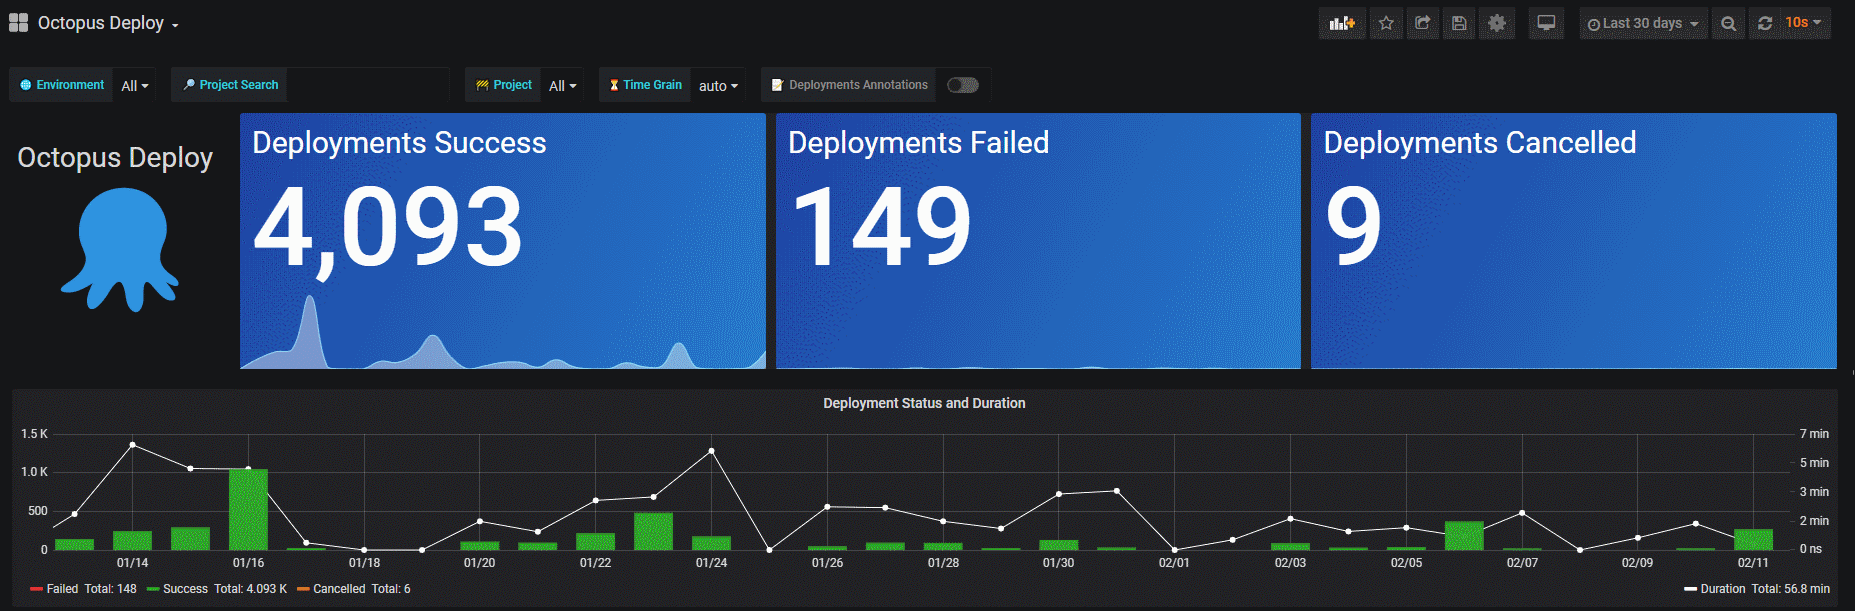
Octopus Deploy Dashboard
Dashboard to visualize Octopus Deploy deployment and task data.
Setup a read-only user with access to the Octopus Deploy SQL Server database.
SQL Server Express
If you are using the included SQL Server Express you'll have a few more hoops to jump through to enable access on port 1433 remotely from Grafana. To enable TCP/IP connections on SQL Express open the SQL Server Configuration Manager. Under SQL Server Network Configuration select Protocols for SQLEXPRESS. Right click TCP/IP and open Properties. Scroll down to IPAll and blank out TCP Dynamic Ports and set TCP Port to 1433. You may need to set your local windows firewall to allow port 1433 through.
Bugs, suggestions and feedback
Bug reports, suggestions and feedback to GitHub please!
Dashboard
Dashboard is setup to filter the variables based on the Project search box. Type a full or partial search term to filter the board automatically, no need to then select individual projects.
The Deployment Annotations will display over the top of the time series line graph, and hovering over will give details on each deployment. These are also filtered based on the variables at the top of the page.


Data source config
Collector config:
Upload an updated version of an exported dashboard.json file from Grafana
| Revision | Description | Created | |
|---|---|---|---|
| Download |