Metricbeat System and Kubernetes Resource Usage Dashboard
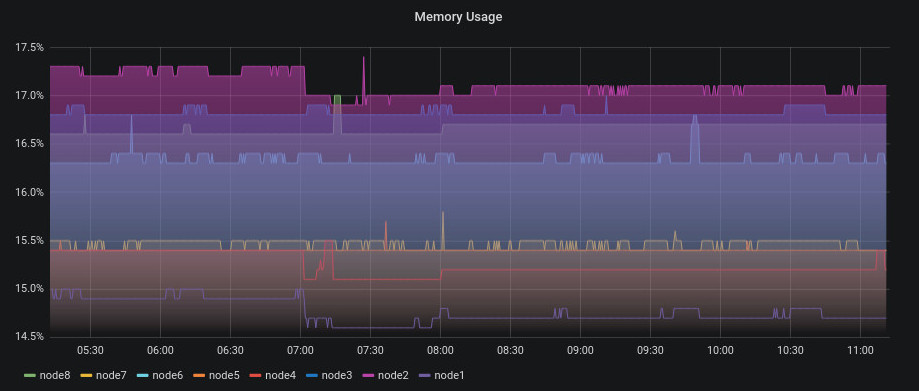
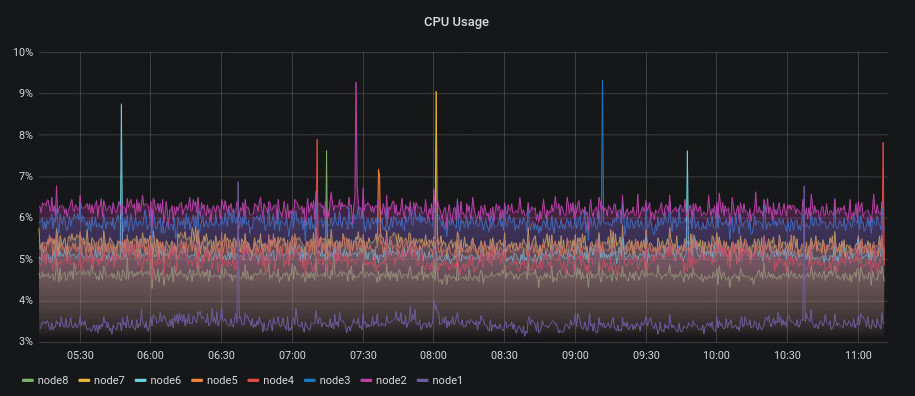
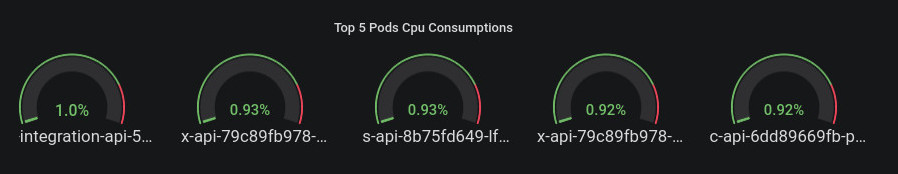
Send metrics to elasticsearch using metricbeat, visualize them via Grafana. This example dashboard contains, system memory usage, system cpu usage, kubernetes pod cpu usage and kubernetes pod memory usage, file system usage.
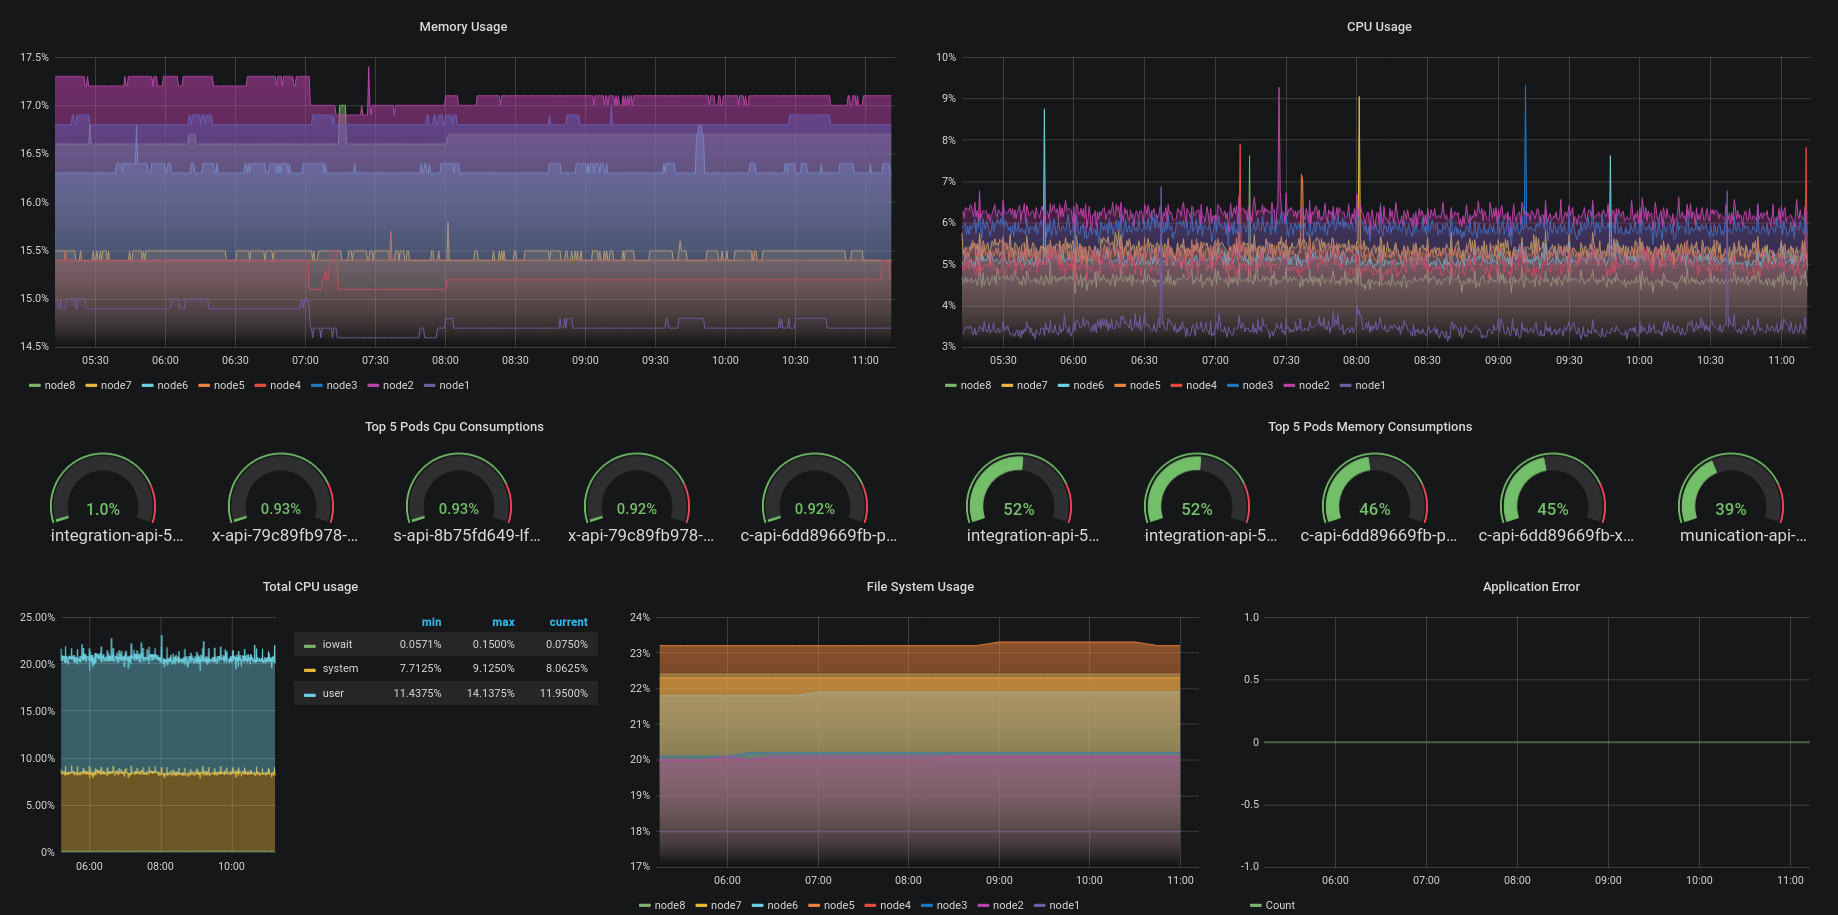
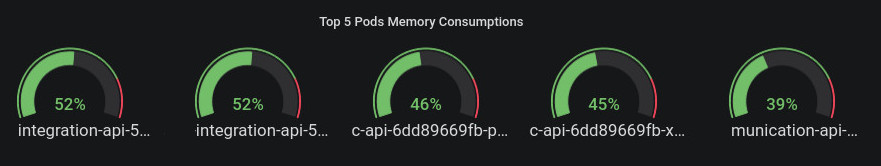
The Metricbeat System and Kubernetes Resource Usage Dashboard dashboard uses the elasticsearch data source to create a Grafana dashboard with the gauge and graph panels.
Data source config
Collector type:
Collector plugins:
Collector config:
Revisions
Upload an updated version of an exported dashboard.json file from Grafana
| Revision | Description | Created | |
|---|---|---|---|
| Download |
Kubernetes
Monitor your Kubernetes deployment with prebuilt visualizations that allow you to drill down from a high-level cluster overview to pod-specific details in minutes.
Learn more