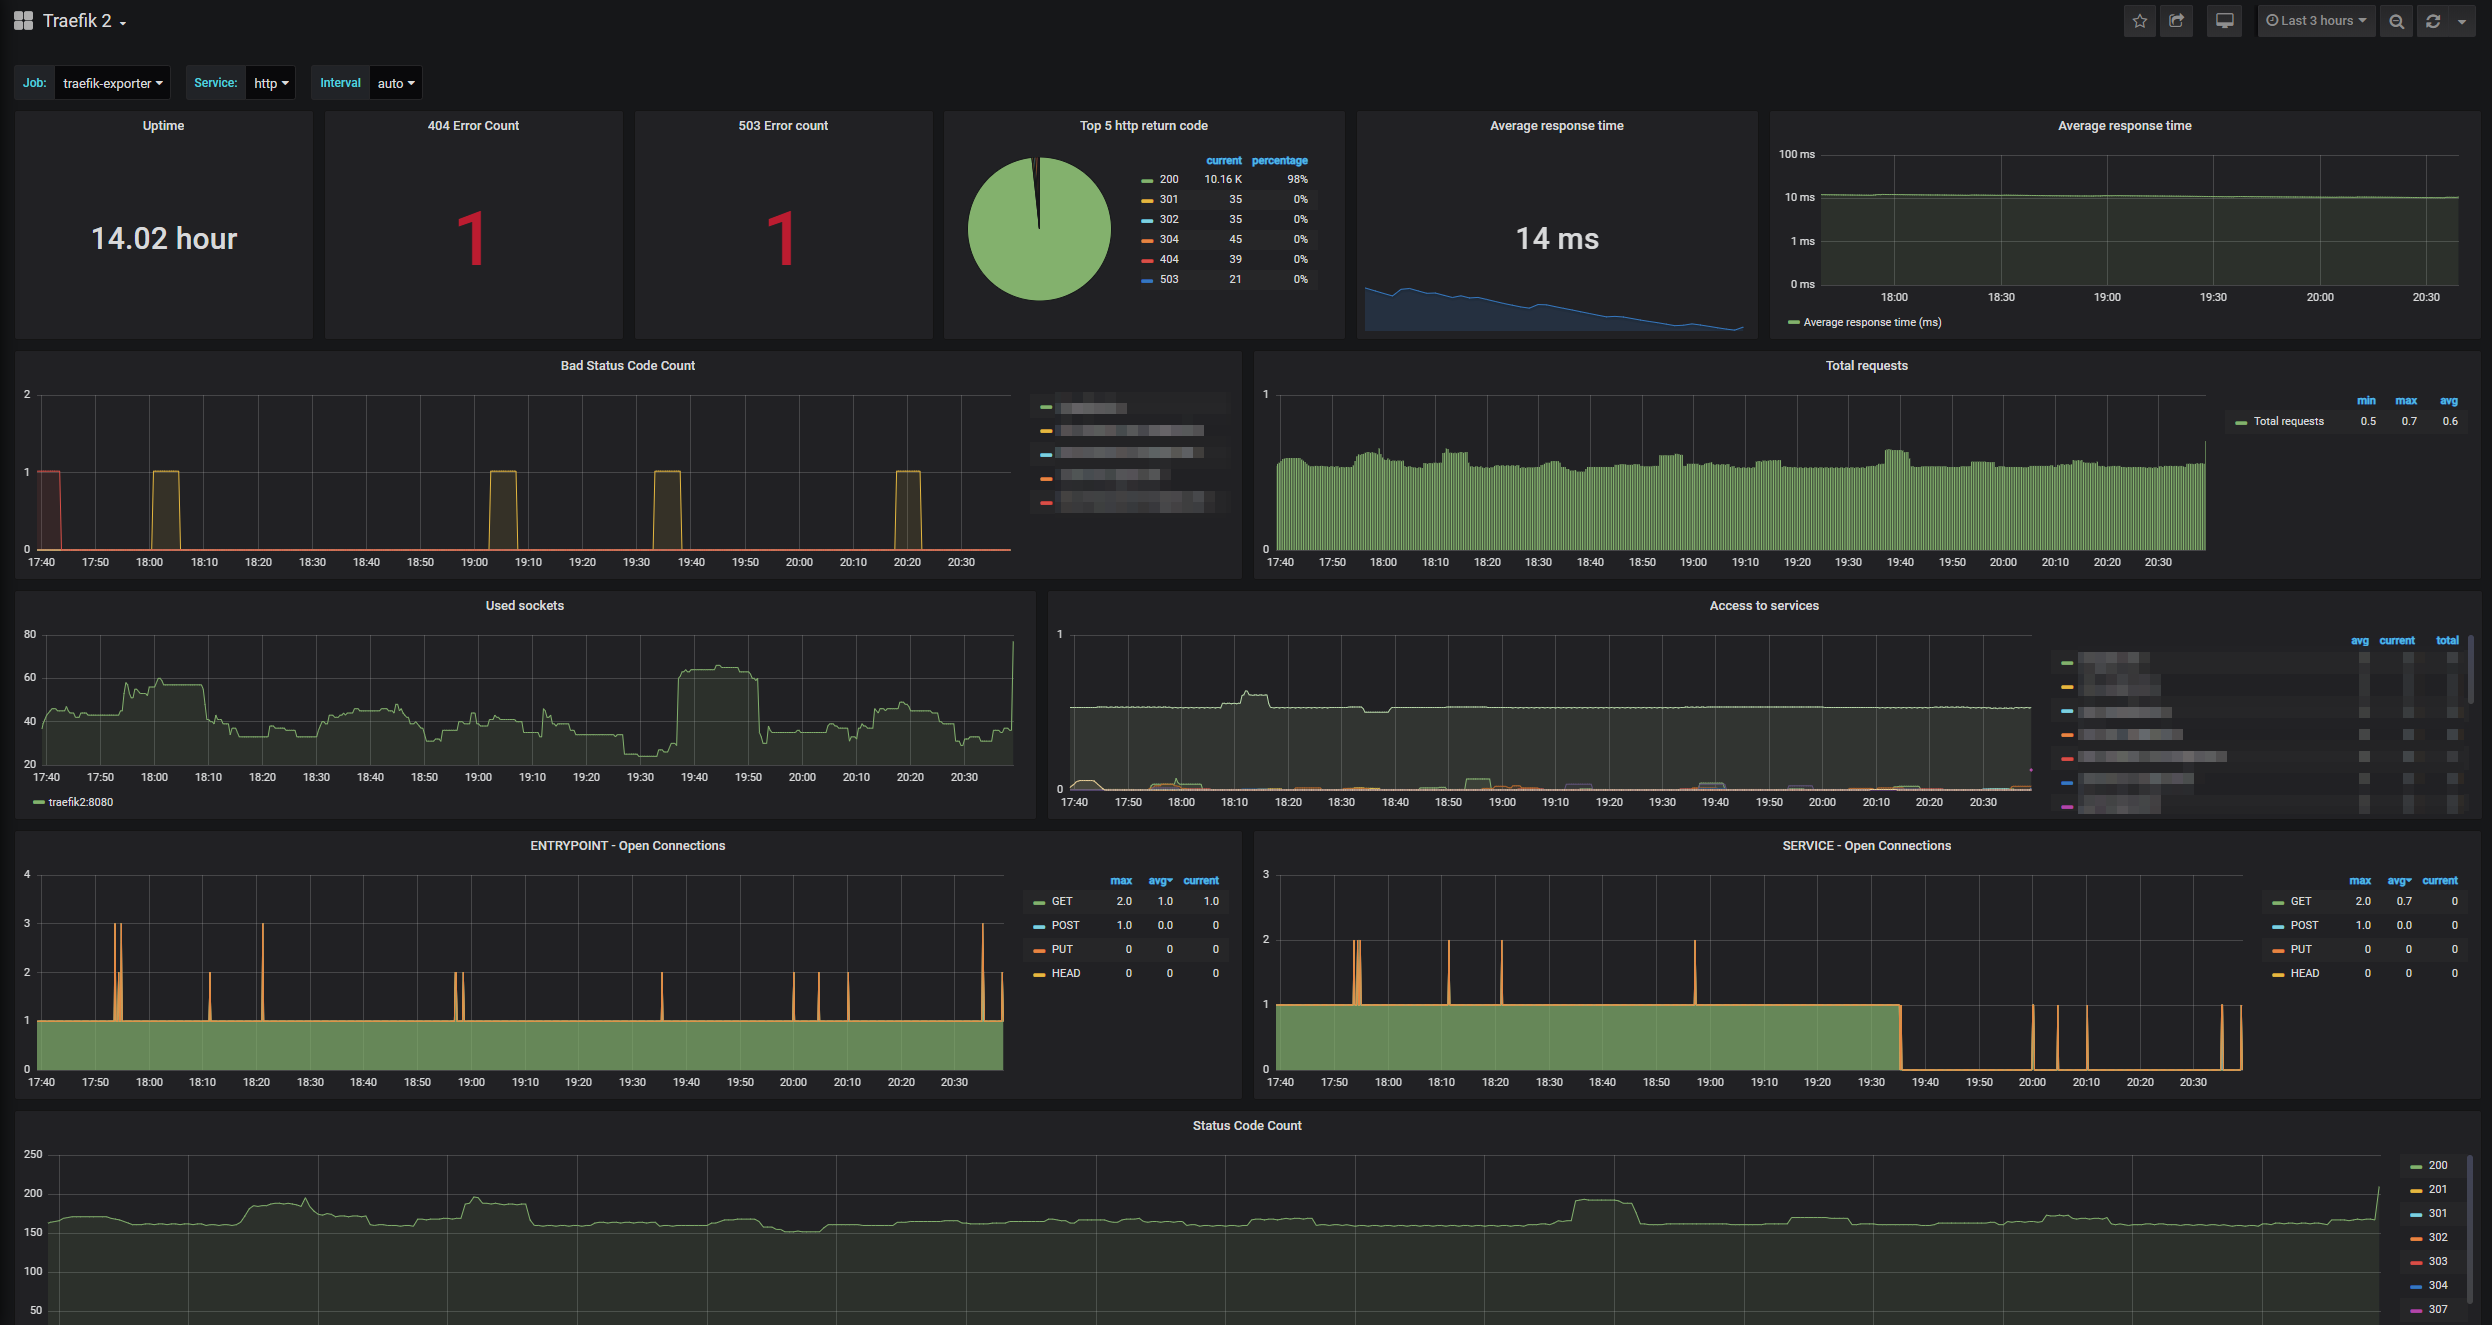
Traefik 2
Simple dashboard for Traefik 2
Simple dashboard for Traefik 2, visualizing every important metric for your Traefik instance(s).
It provides you with statistics to your internals of Traefik, HTTP statics and gives you a brief overview on the health of your traefik instance(s).
Originally this dashobard has been created by ichasco, that can also be found on grafana.com.
Data source config
Collector type:
Collector plugins:
Collector config:
Revisions
Upload an updated version of an exported dashboard.json file from Grafana
| Revision | Description | Created | |
|---|---|---|---|
| Download |
Traefik
Easily monitor Traefik, the dynamic load balancer, with Grafana Cloud's out-of-the-box monitoring solution.
Learn more