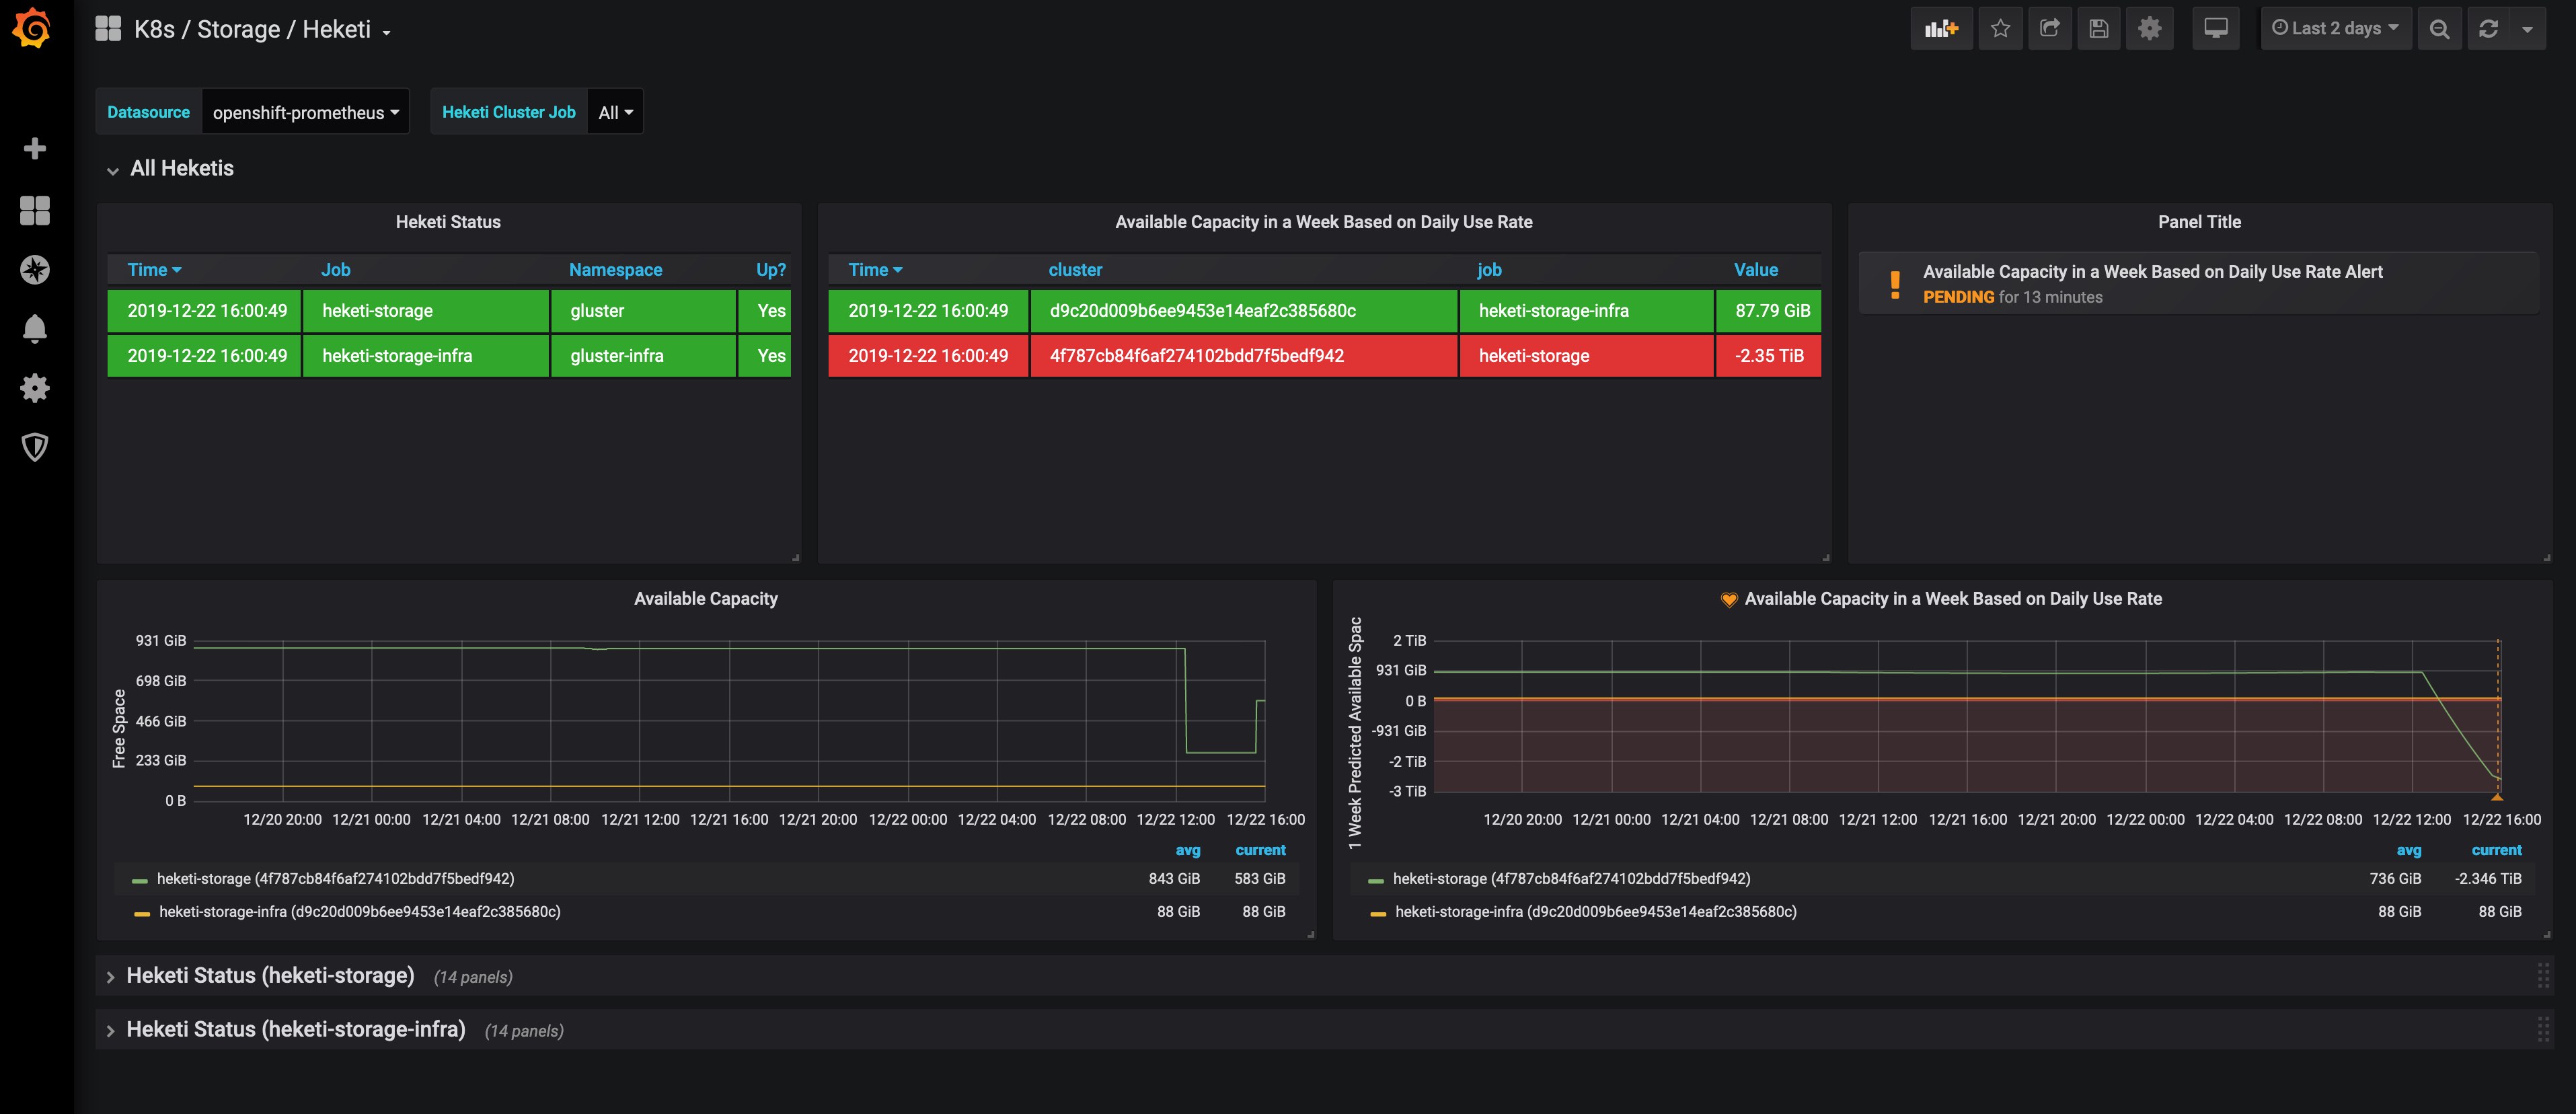
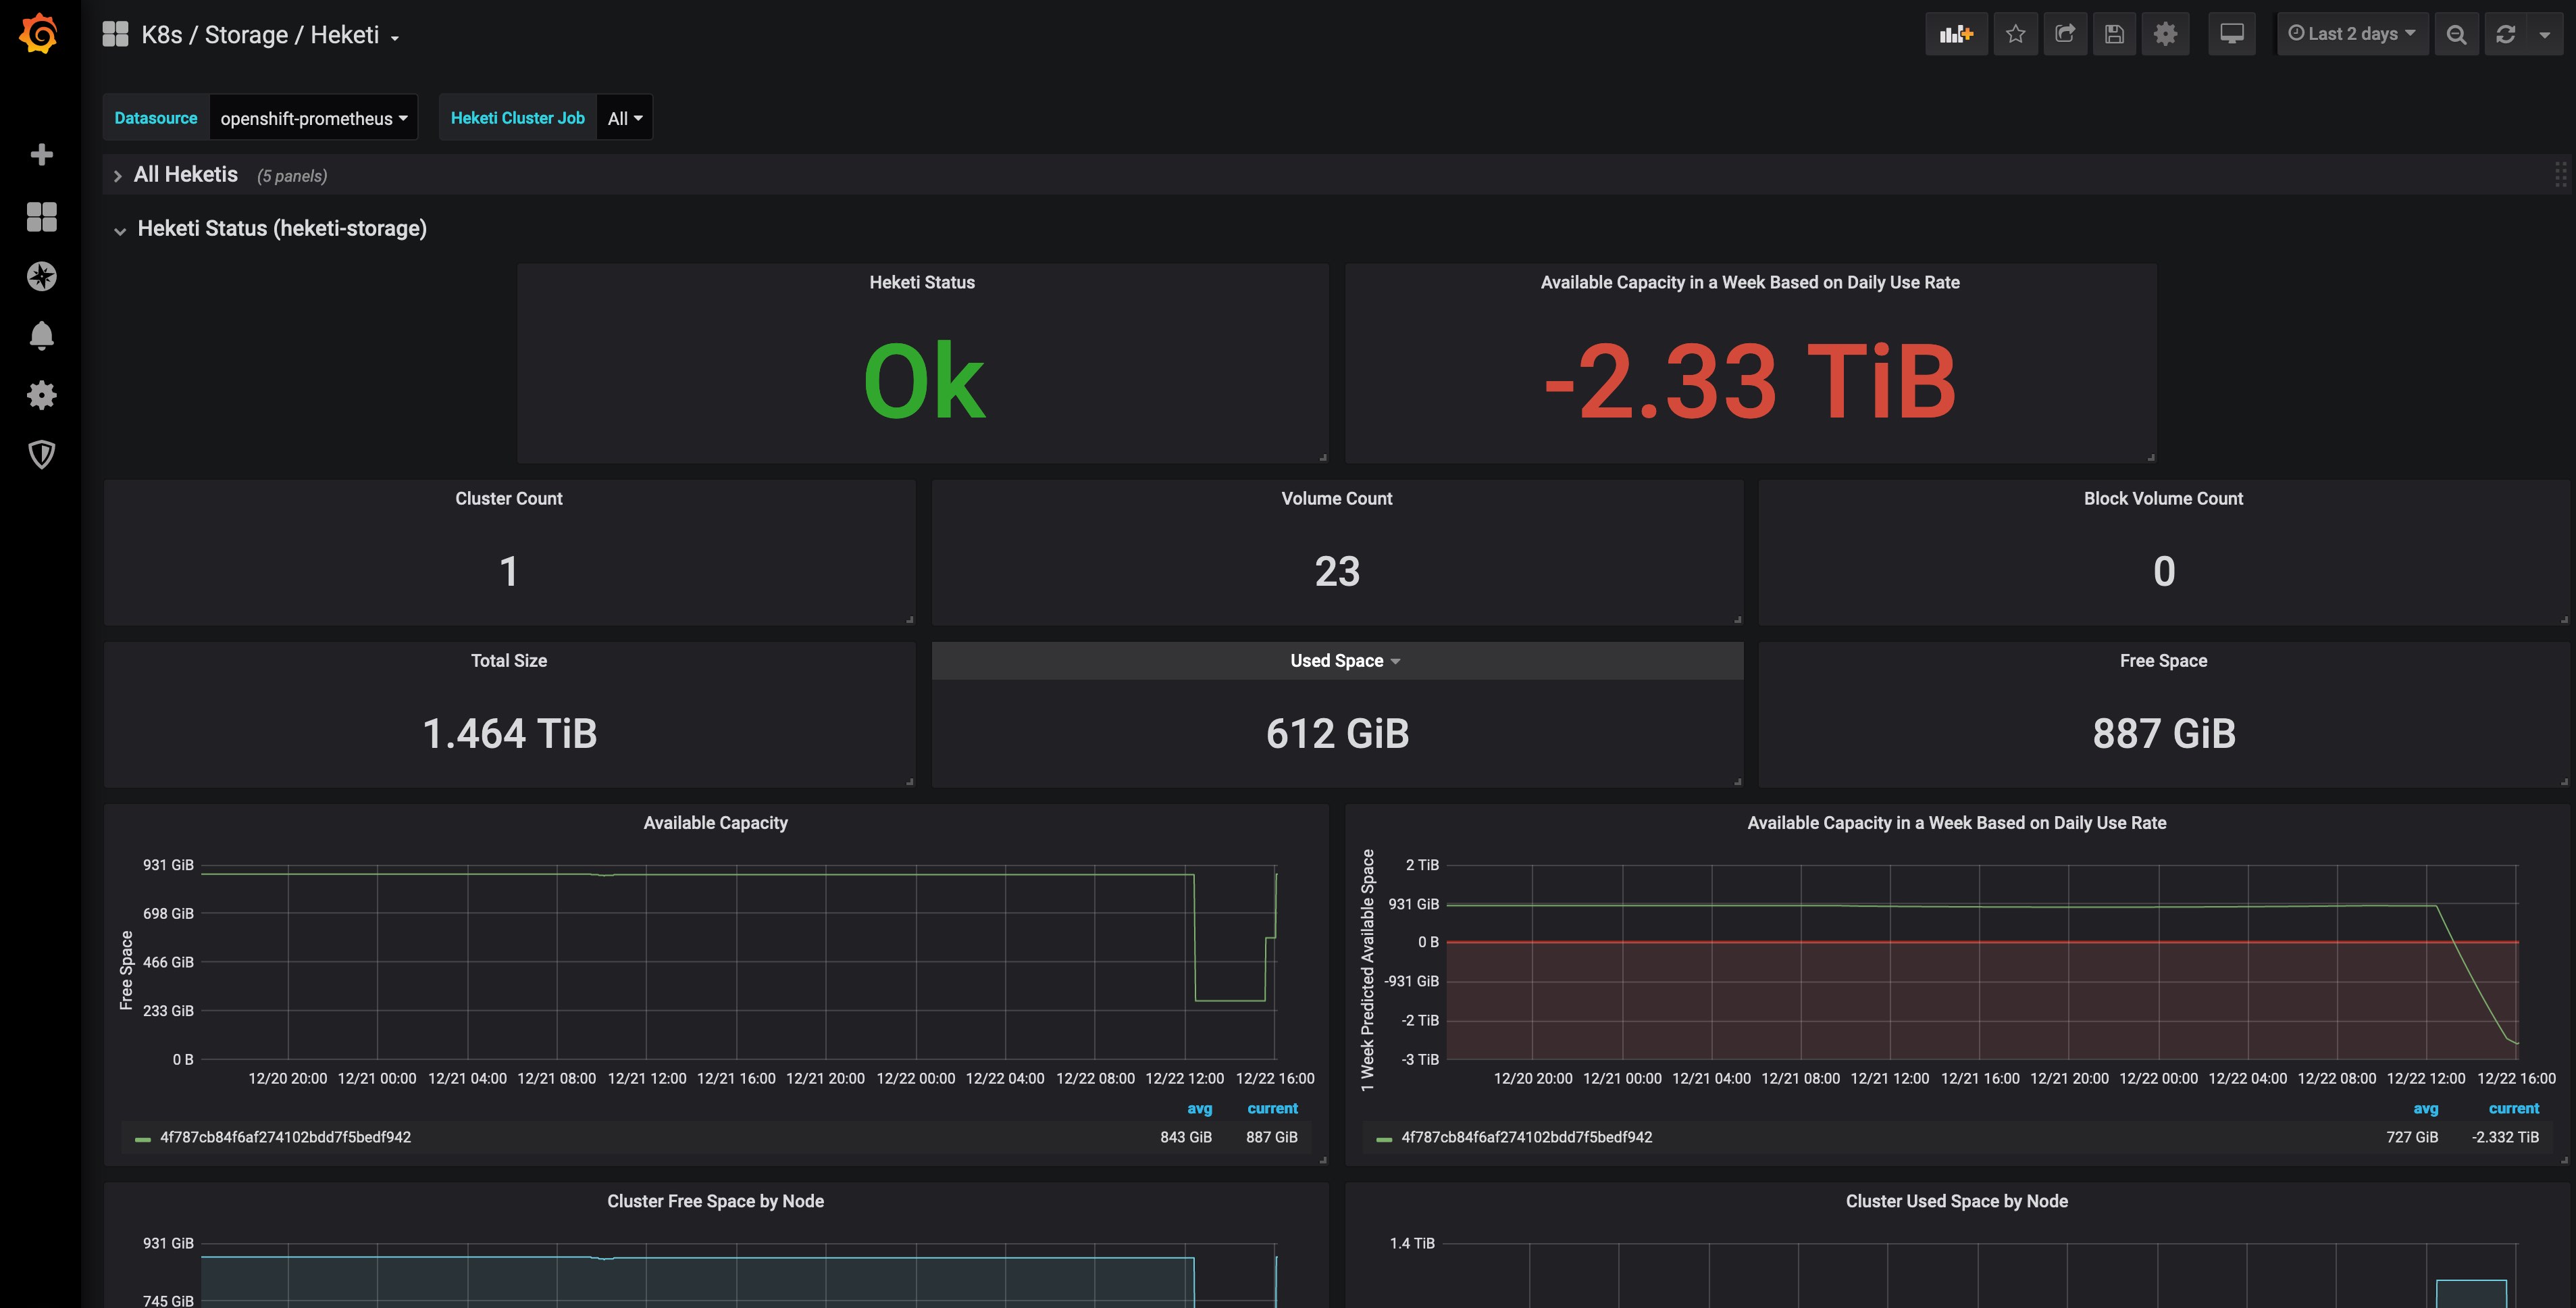
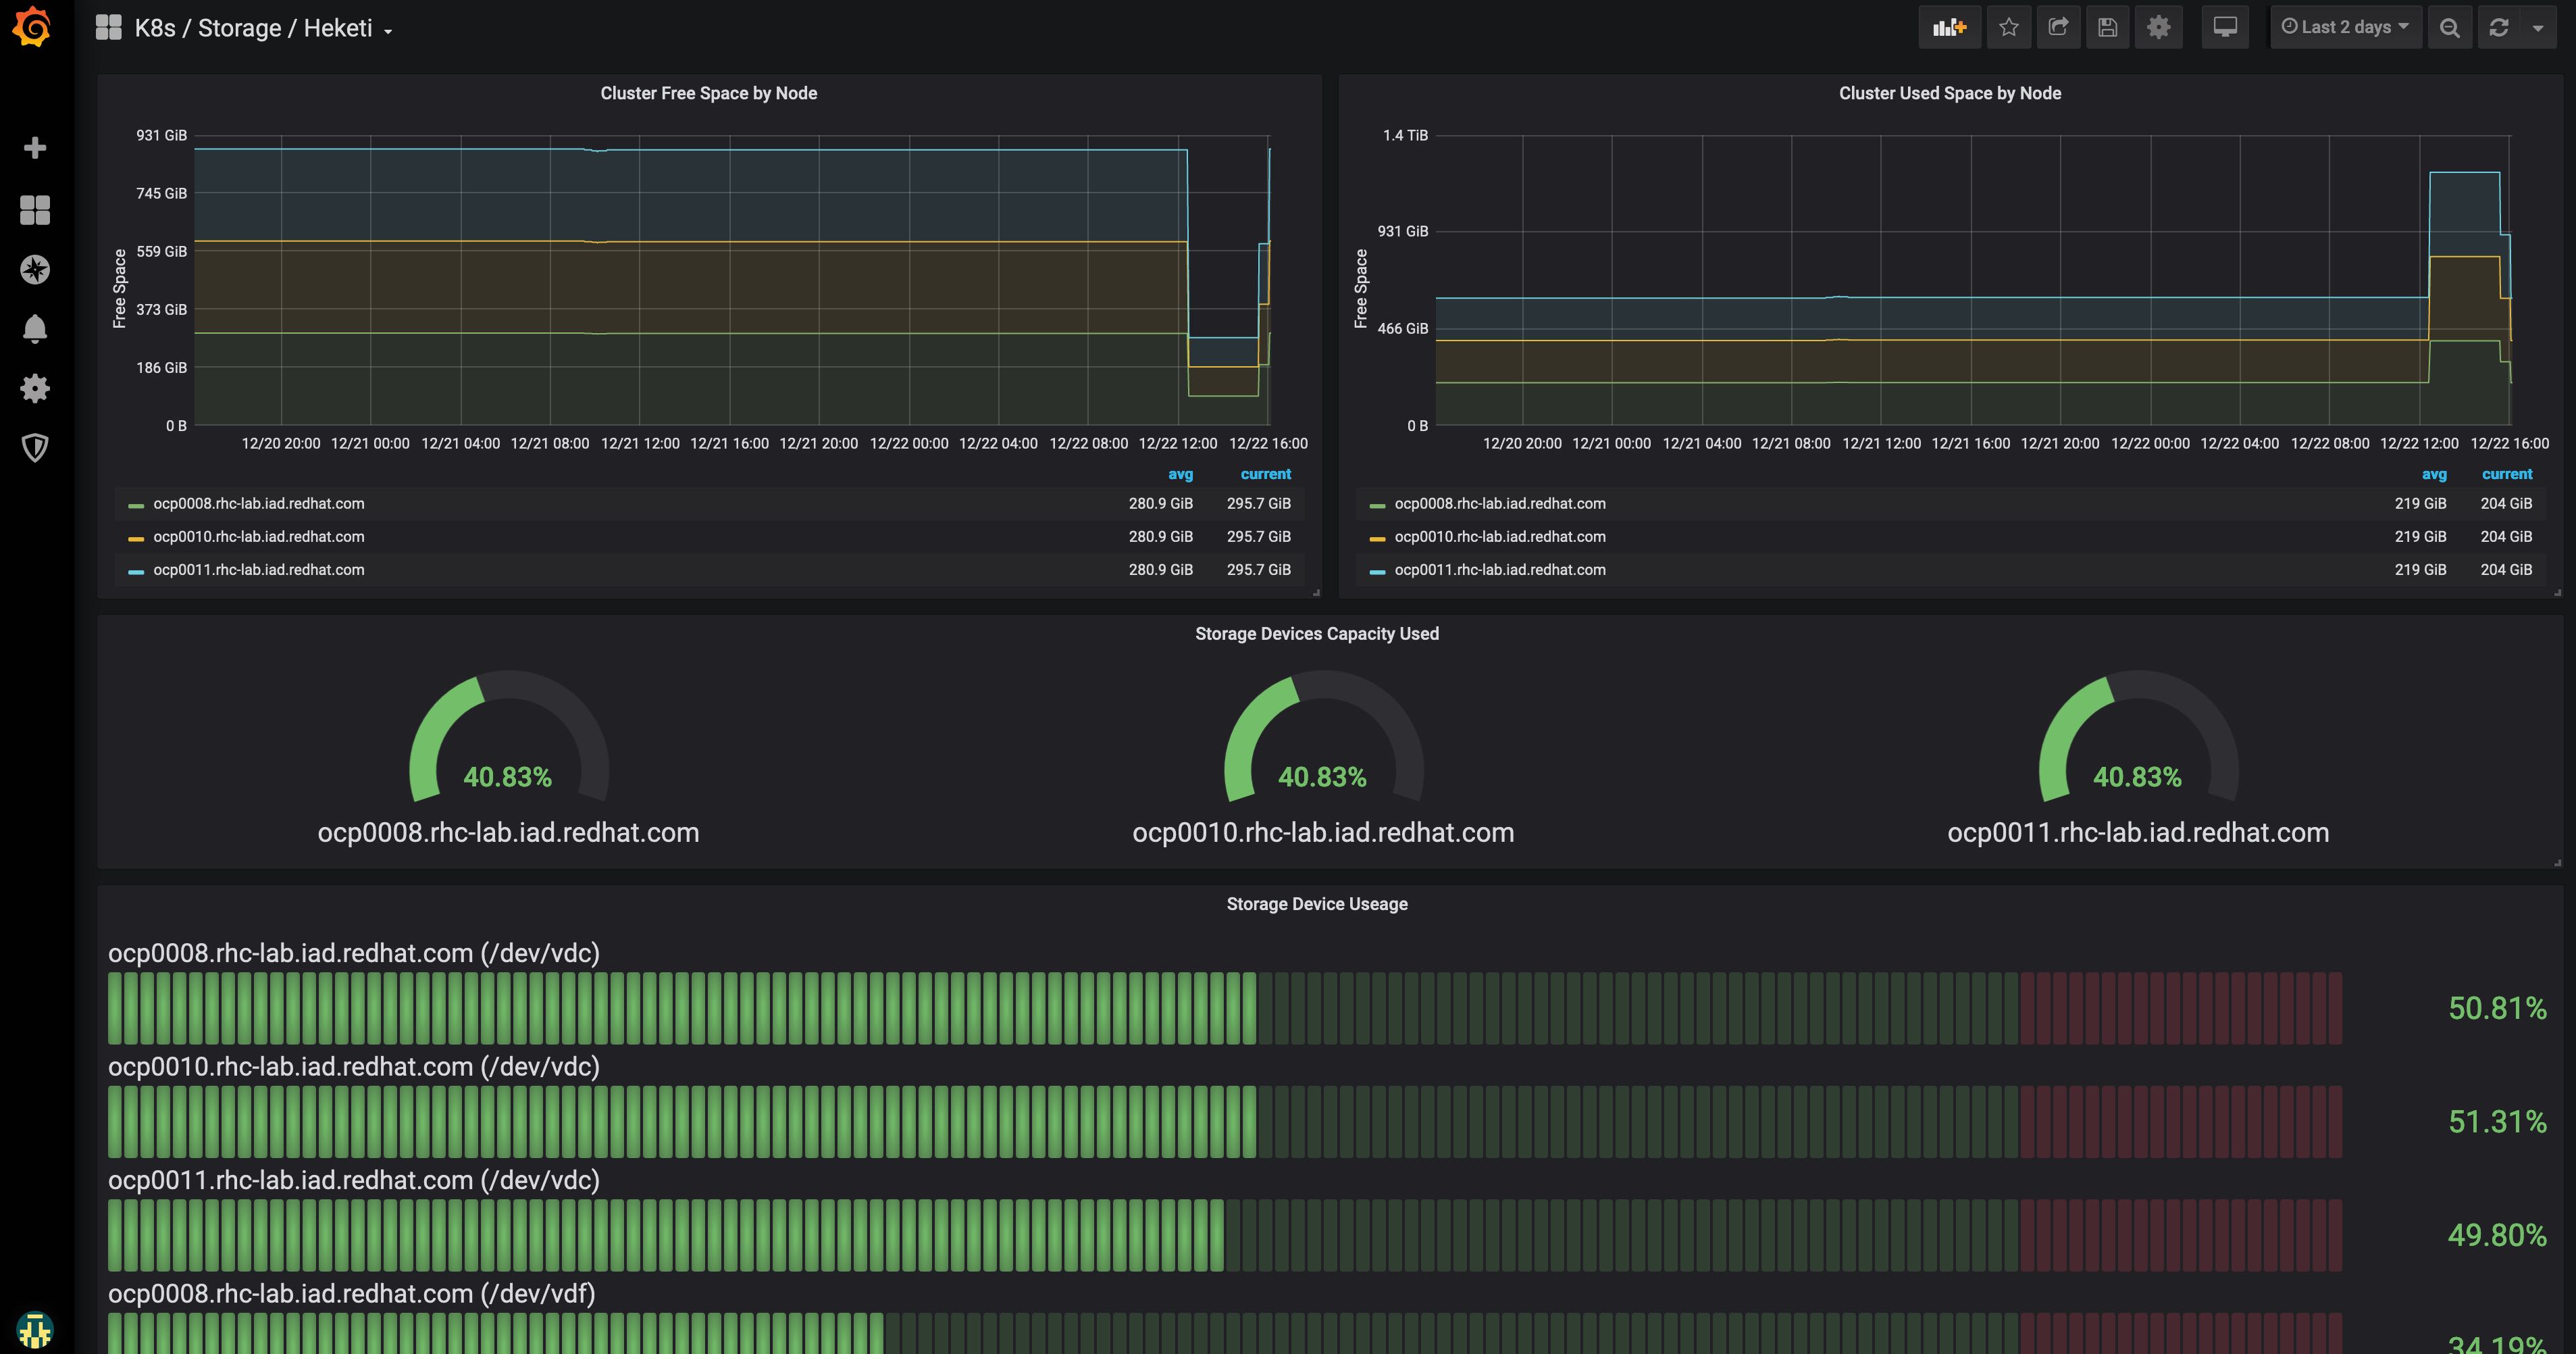
K8s / Storage / Heketi
Dashboard of data exported from Heketi via Prometheus Service as deployed by OpenShift Container Storage (OCS) 3.x.
Overview
Dashboard of data exported from Heketi via Prometheus Service as deployed by OpenShift Container Storage (OCS) 3.x.
Expects
heketi_cluster_countheketi_device_free_bytesheketi_device_size_bytesheketi_device_used_bytesheketi_nodes_countheketi_volumes_countheketi_block_volumes_countheketi_up
Published Grafana Alerts
Available Capacity in a Week Based on Daily Use Rate Alert
Documentation
- Set up Prometheus on OpenShift - Red Hat OpenShiftr Container Platform 3.11: Configuring Clusters: Prometheus Cluster Monitoring
- Set up OCS 3.11 to export Heketi data to Prometheus - Red Hat OpenShift Container Storage 3.11: Operations Guide: 10.1. Available Metrics for File Storage and Block Storage.
Tested With
- OpenShift Container Platform (OCP)
- v3.11.154
- OpenShift Container Storage (OCS)
- 3.11
- Grafana
- v6.5.2
- Prometheus
- v2.3.2
Related Boards
Data source config
Collector type:
Collector plugins:
Collector config:
Revisions
Upload an updated version of an exported dashboard.json file from Grafana
| Revision | Description | Created | |
|---|---|---|---|
| Download |
Kubernetes
Monitor your Kubernetes deployment with prebuilt visualizations that allow you to drill down from a high-level cluster overview to pod-specific details in minutes.
Learn more