ZFS Monitoring Dashboard
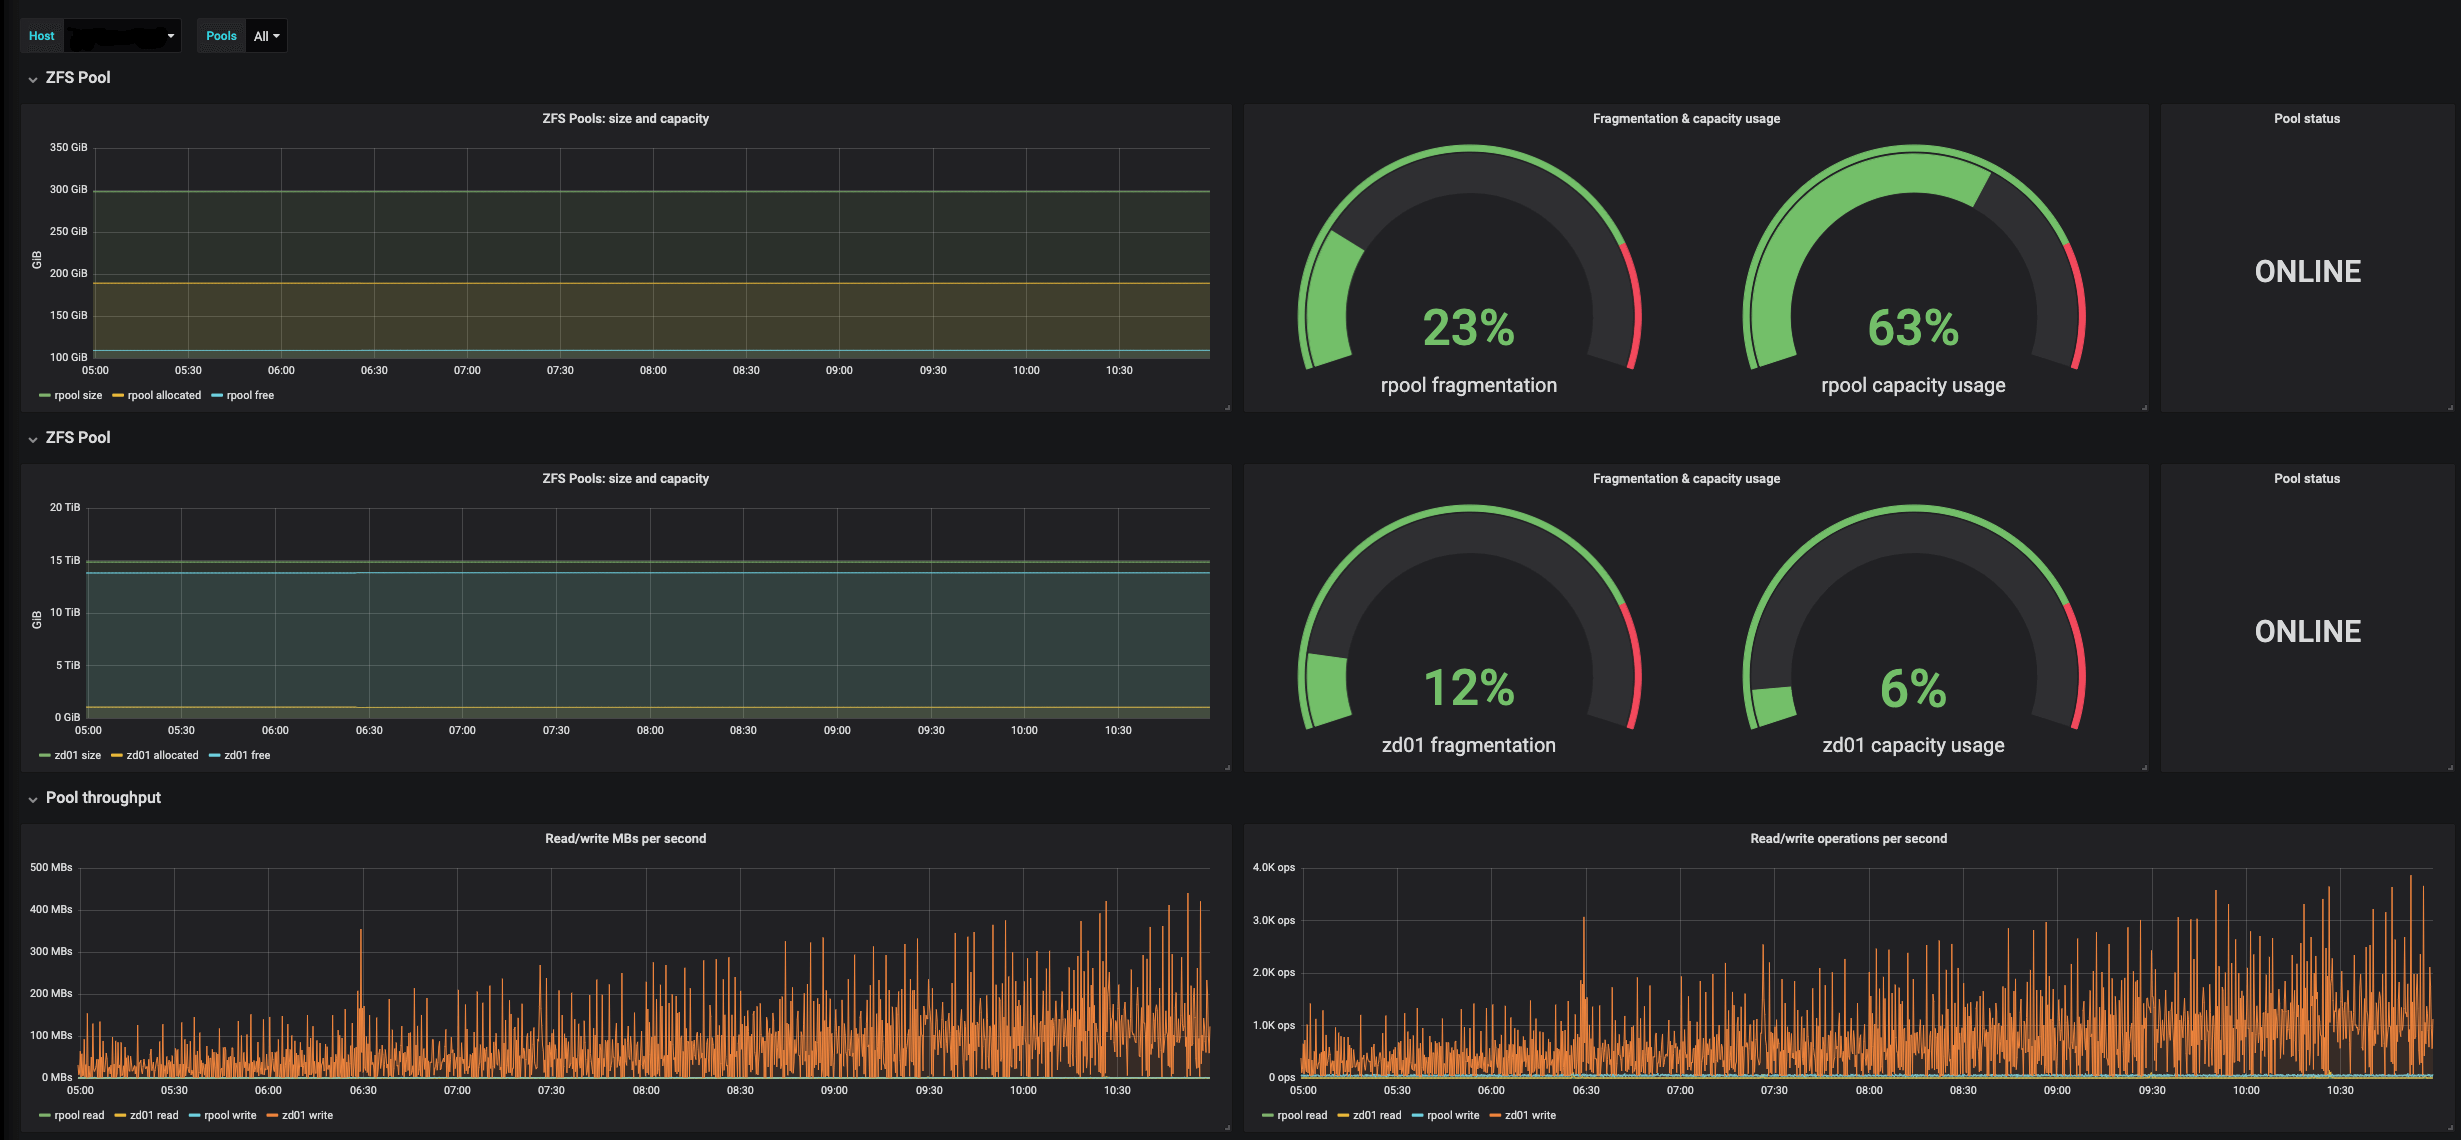
Pool metrics collection in Telegraf ZFS plugin must be enabled: poolMetrics = true
Data source config
Collector type:
Collector plugins:
Collector config:
Revisions
Upload an updated version of an exported dashboard.json file from Grafana
| Revision | Description | Created | |
|---|---|---|---|
| Download |