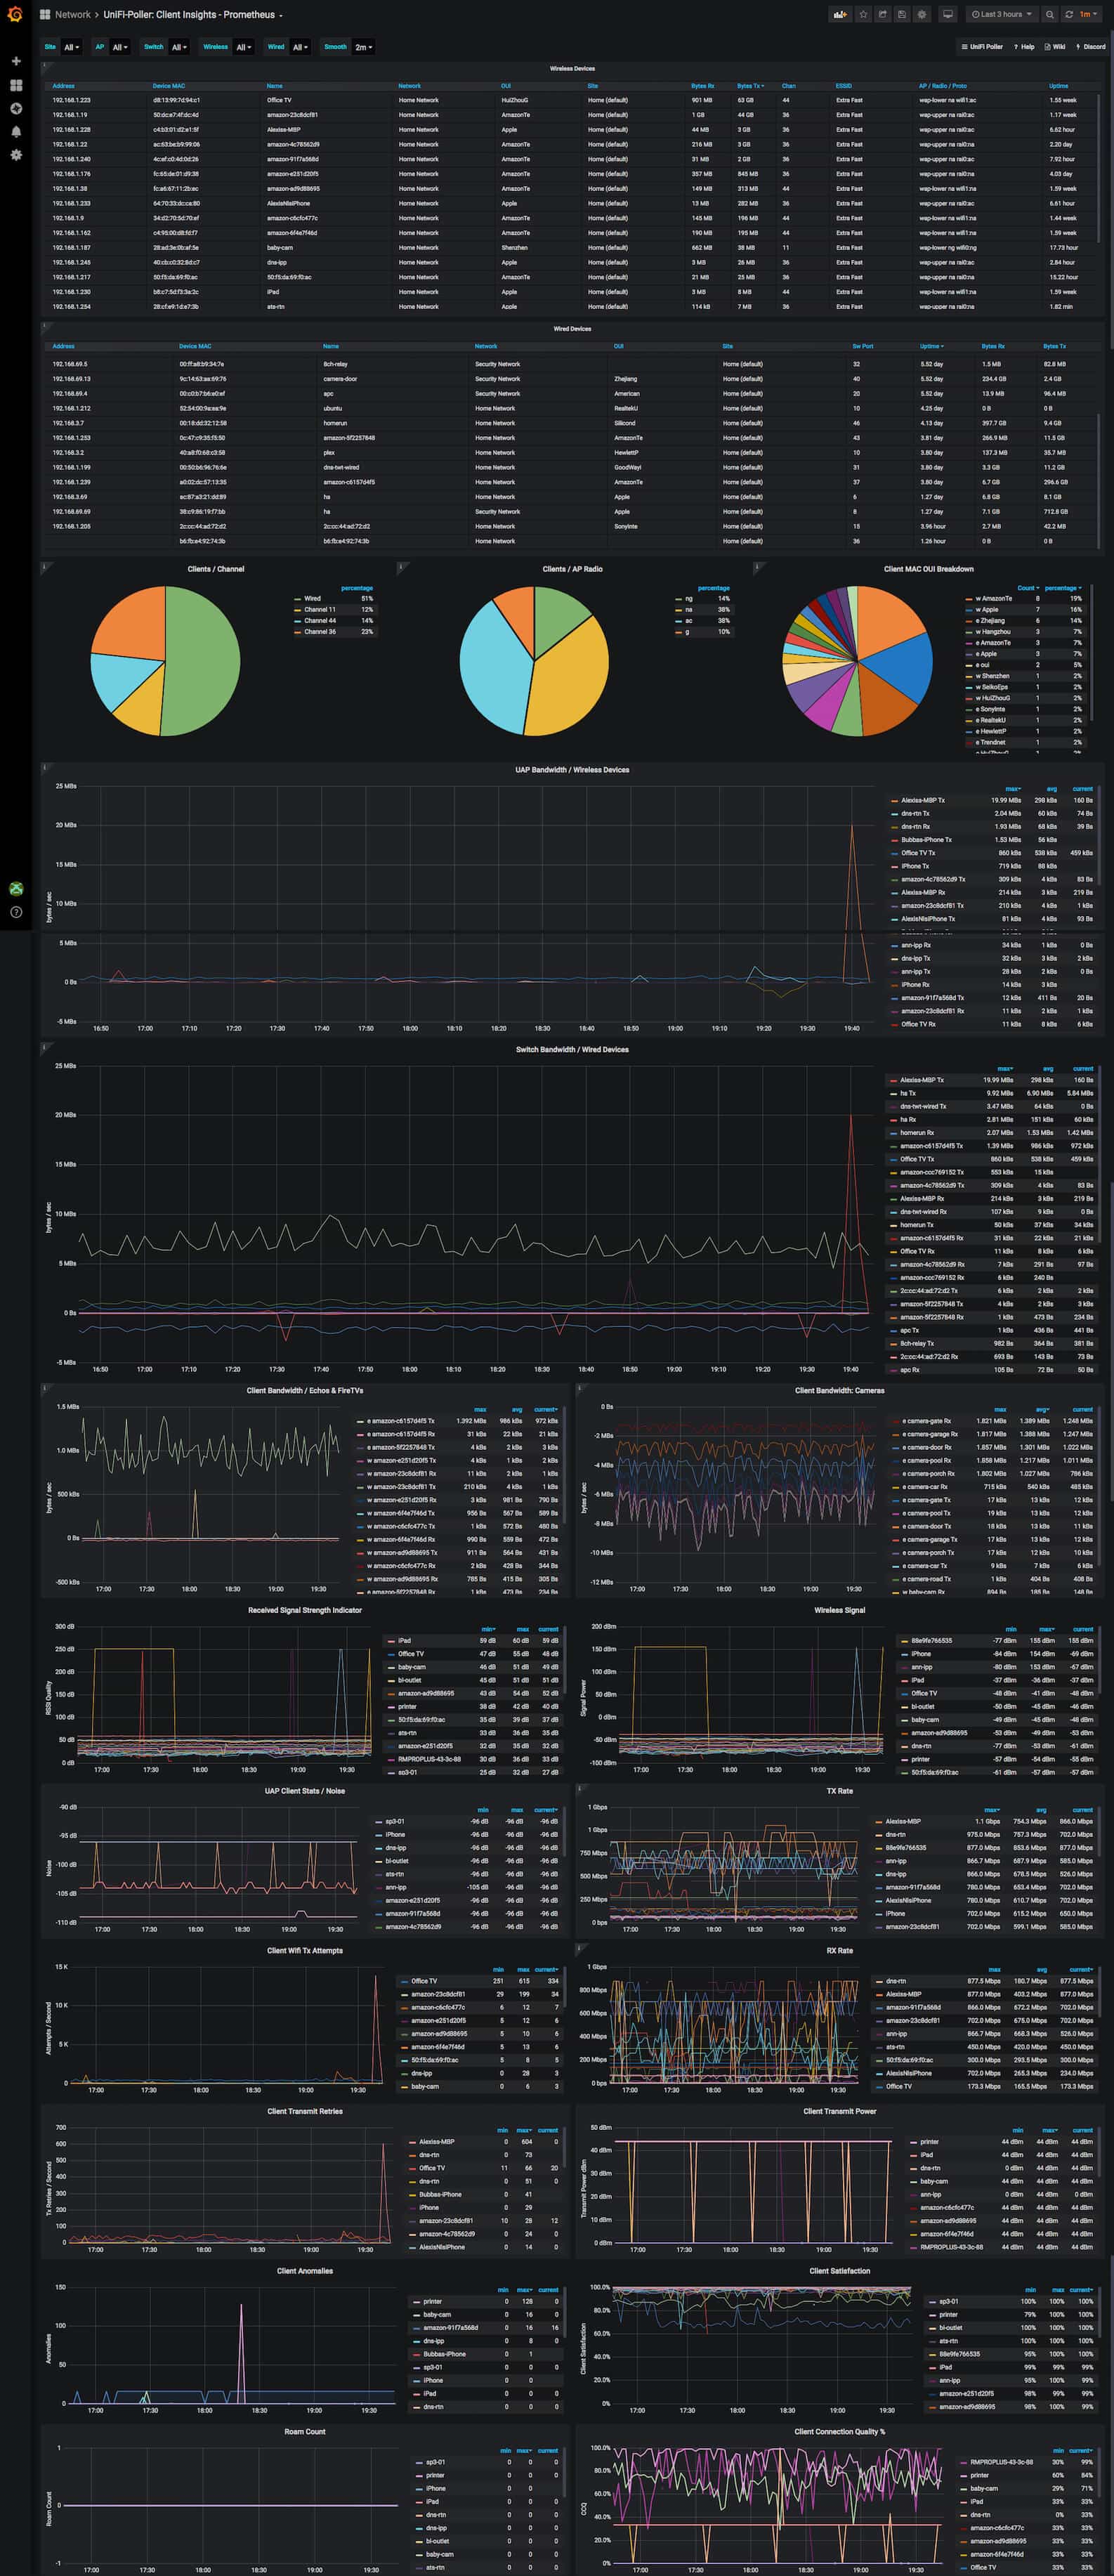
UniFi-Poller: Client Insights - Prometheus
UniFi Poller v2.0.1 Displays detailed information for clients in a UniFi network using Prometheus.
Updated for Poller v2.0!
UniFi Clients: Prometheus Dashboard
If your UniFi Network has clients (it does), you want to get this dashboard. This dashboard displays detailed information for clients found in a UniFi controller. You should also get the Sites dashboard.
The dashboard is multi-site capable. The data displayed is stored in Prometheus by Unifi Poller. This is one of several UniFi Poller dashboards. Click this link to see them all.
UniFi Poller is a small Golang application that runs on Windows, FreeBSD, macOS, Linux or Docker. The application opens a web port and when prometheus polls for data it translates the UniFi controller API metrics to Prometheus exported metrics.
More
Ubiquiti makes networking devices like switches, gateways (routers) and wireless access points. They have a line of equipment named UniFi that uses a controller to keep stats and simplify network device configuration. This controller can be installed on Windows, macOS and Linux. Ubiquiti also provides a dedicated hardware device called a CloudKey that runs the controller software.
Data source config
Collector config:
Upload an updated version of an exported dashboard.json file from Grafana
| Revision | Description | Created | |
|---|---|---|---|
| Download |
Metrics Endpoint (Prometheus)
Easily monitor any Prometheus-compatible and publicly accessible metrics URL with Grafana Cloud's out-of-the-box monitoring solution.
Learn more
