Cache health
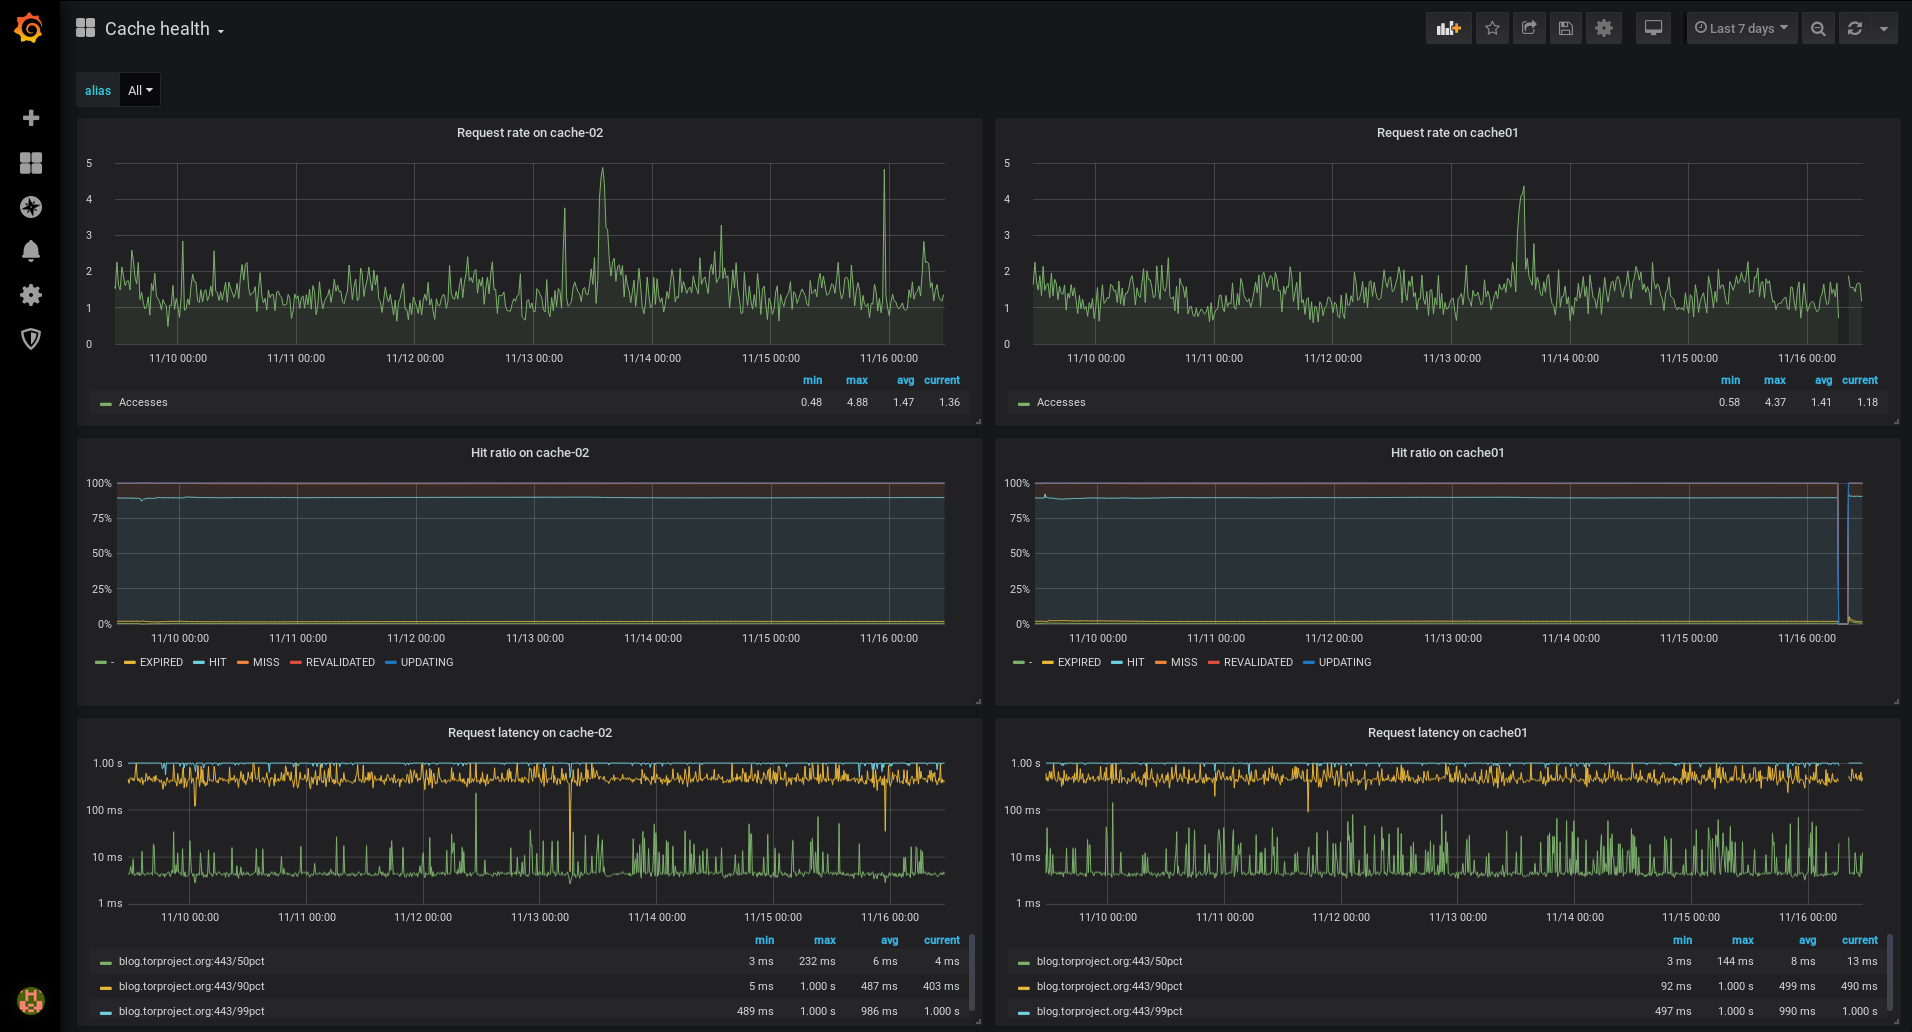
A panel to extract graphs from Prometheus data collected from mtail parsing of custom Nginx logs with hit ratio.
More details coming soon.
Data source config
Collector type:
Collector plugins:
Collector config:
Revisions
Upload an updated version of an exported dashboard.json file from Grafana
| Revision | Description | Created | |
|---|---|---|---|
| Download |
Varnish Cache
Easily monitor Varnish Cache, an open source web application accelerator, with Grafana Cloud's out-of-the-box monitoring solution.
Learn more