Telegraf: system dashboard
Prometheus/victoriametrics dashboards for telegraf metrics
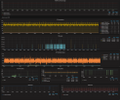
Converted from dashboard #928 from influxdb for victoriametrics.
Templated dashboard for telegraf + victoriametrics.
- CPUs (defaults to all)
- Disks (per-disk IOPS)
- Network interfaces (packets, bandwidth, errors/drops)
- Mountpoints (space / inodes)
Metrics:
- Detailed network stack info, nstat plugin allows us to grab raw snmp data, ie:
- TCP handshakes data
- TCP aborts data
- ICMP errors, ICMP data
- SYN data
- TCP errors (retransmissions/etc)
- IPv4 errors
- IPv6 errors
- Conntrack data
- File descriptors
- UDP data *...And basically everything "generic" you can extract from ordinary linux system
By default all variables points to "all", so dashboard can be huge if you have large amounts of disks/network interfaces. So far i tested it on machine with 46 disks, 8 interfaces and it loaded correctly (but pretty slow, poor browser barely handled all that data)
Data source config
Collector type:
Collector plugins:
Collector config:
Revisions
Upload an updated version of an exported dashboard.json file from Grafana
| Revision | Description | Created | |
|---|---|---|---|
| Download |