Azure / Monitor for Containers - Metrics
Azure Monitor - Container Insights metrics for Kubernetes clusters. Cluster utilization, namespace utilization, Node cpu & memory, Node disk usage & disk io, node network & kubelet docker operation metrics. Many more metrics that are queriable from the log analytics workspace used by Azure monitor for containers!
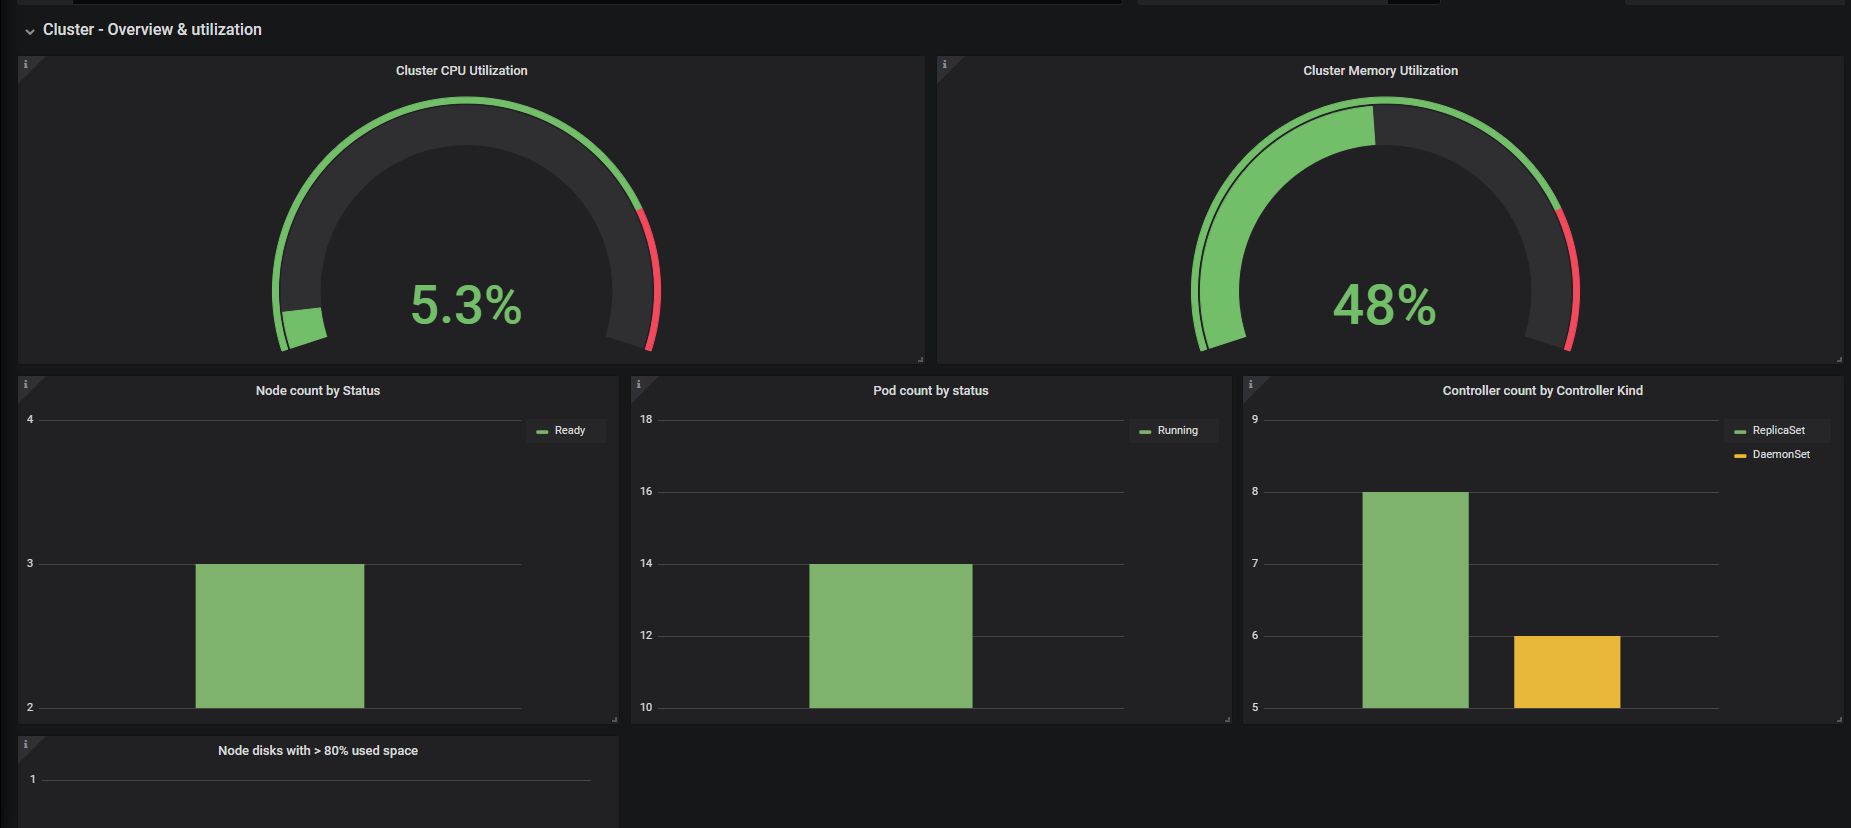
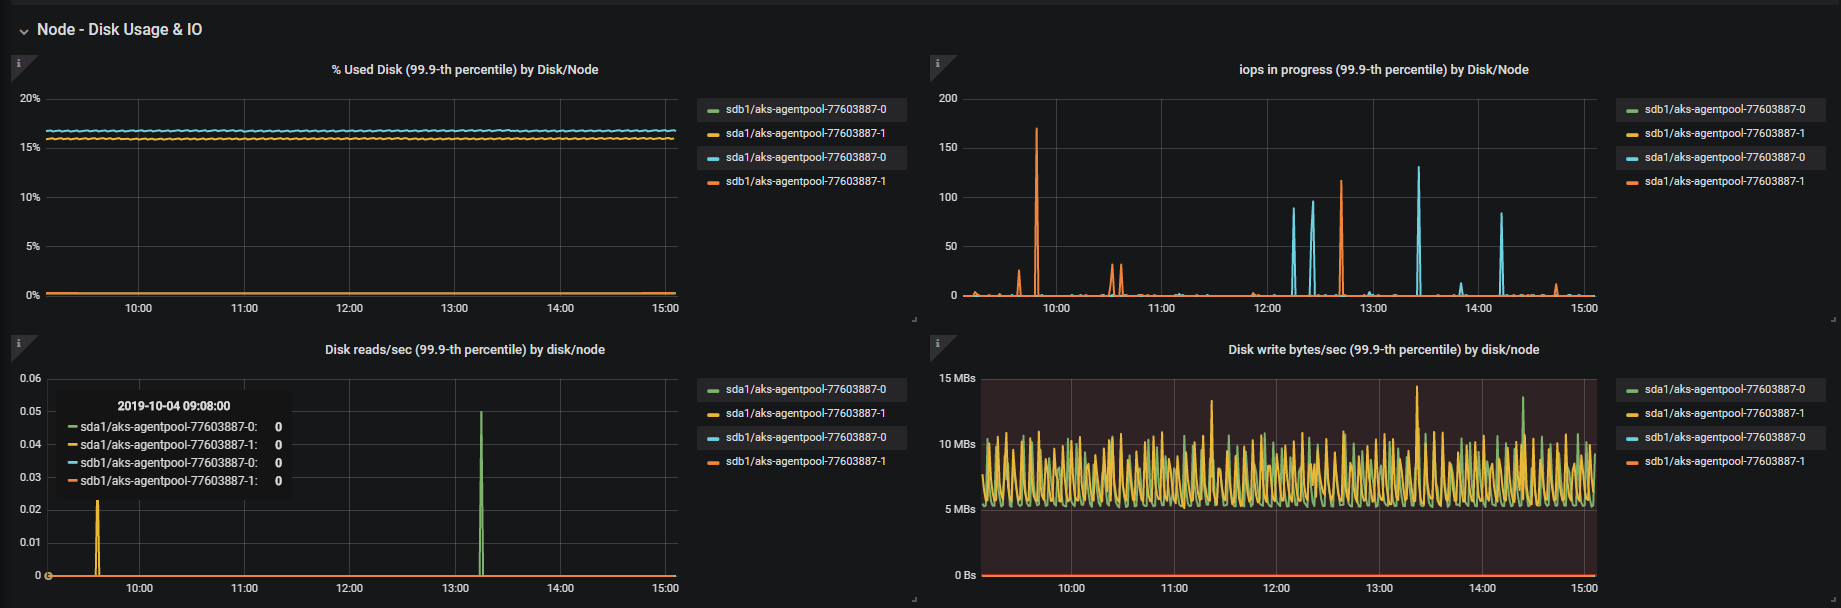
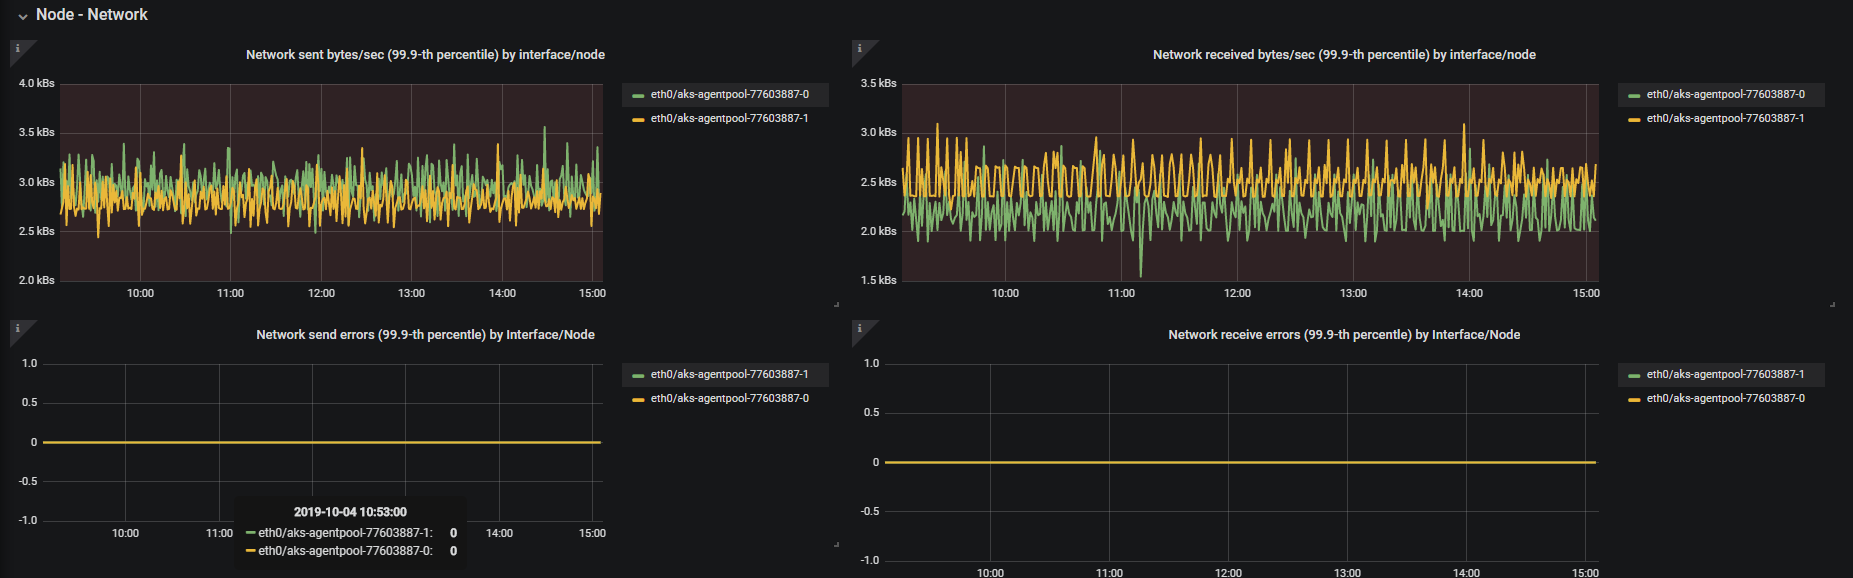
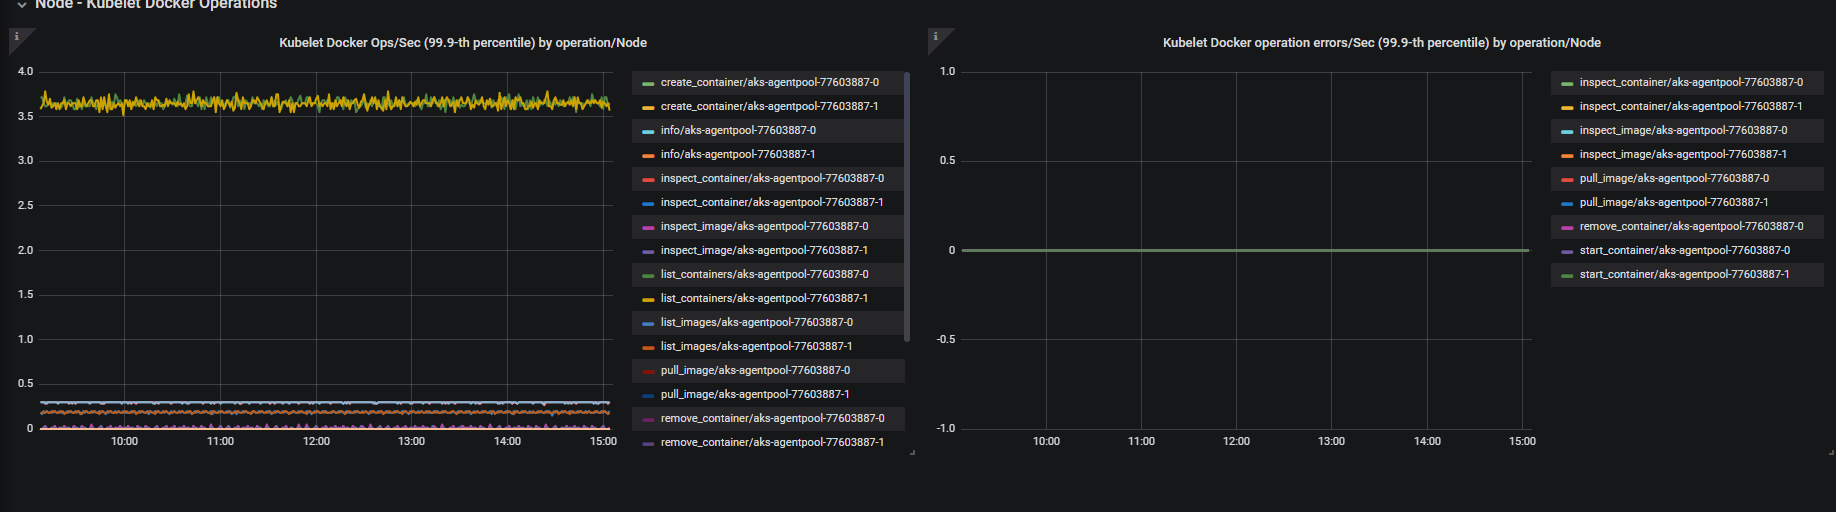
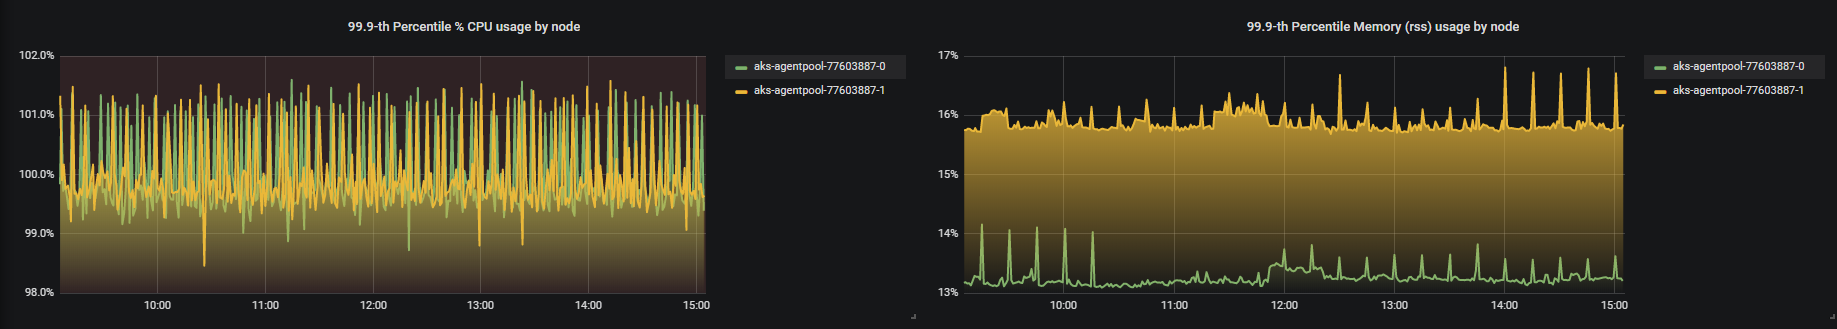
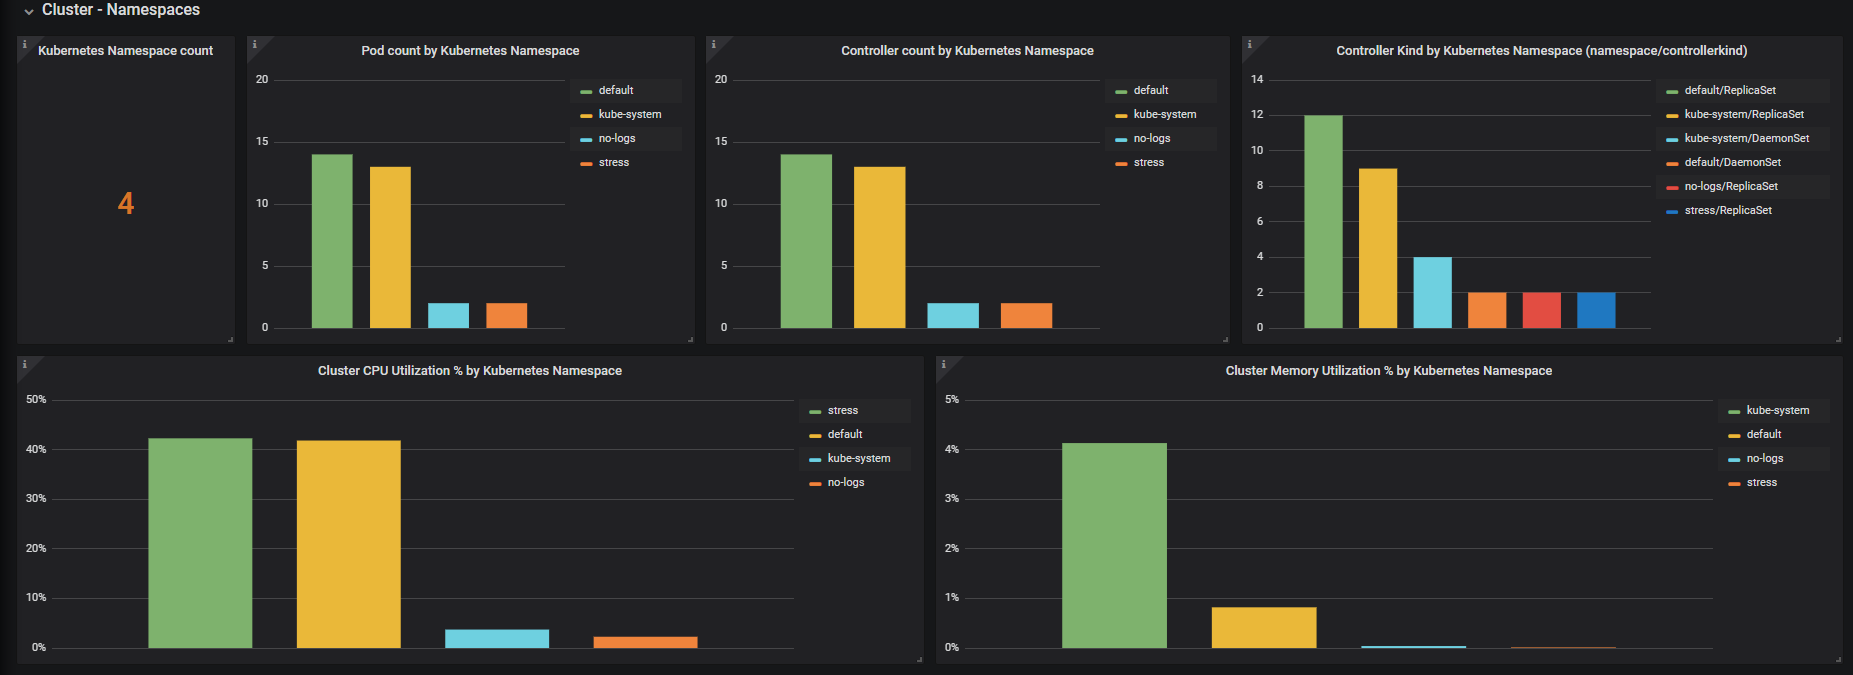
Dashboard showing metrics collected by Azure Monitor for Containers from Azure Log analytics workspace. Container Insights metrics for Kubernetes clusters showing cluster utilization, namespace utilization, Node cpu & memory, Node disk usage & disk io, node network & kubelet docker operation metrics. Many more metrics that are queriable from the log analytics workspace used by Azure monitor for containers! Requires Azure Monitor plugin included in Core Grafana Software
Send your feedbacks to askcoin@microsoft.com
More Information:
Known issue/work around:
Due to a known issue with the data source (tracked by this github issue), you would need to set the Azure Log analytics workspace manually in the charts for the first time after you import the dashboard. Please upvote for the issue above so Grafana can address this issue sooner. Thank you.
Data source config
Collector type:
Collector plugins:
Collector config:
Revisions
Upload an updated version of an exported dashboard.json file from Grafana
| Revision | Description | Created | |
|---|---|---|---|
| Download |
Azure Cosmos DB
With the Grafana plugin for Azure Cosmos DB, you can quickly visualize and query your Azure Cosmos DB data from within Grafana.
Learn more