LINUX x86
Dashboard with Njmon trends. I'm using InfluxDB data source. Graphs has been grouped what makes work easier (Don't need to scroll so much).
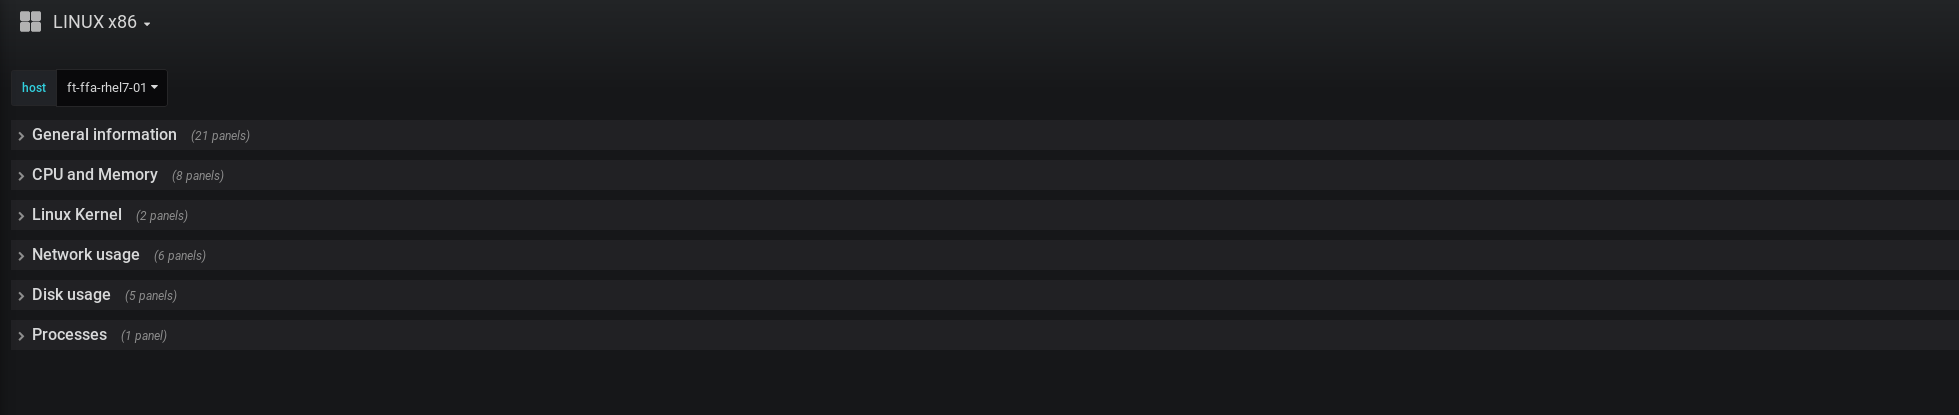
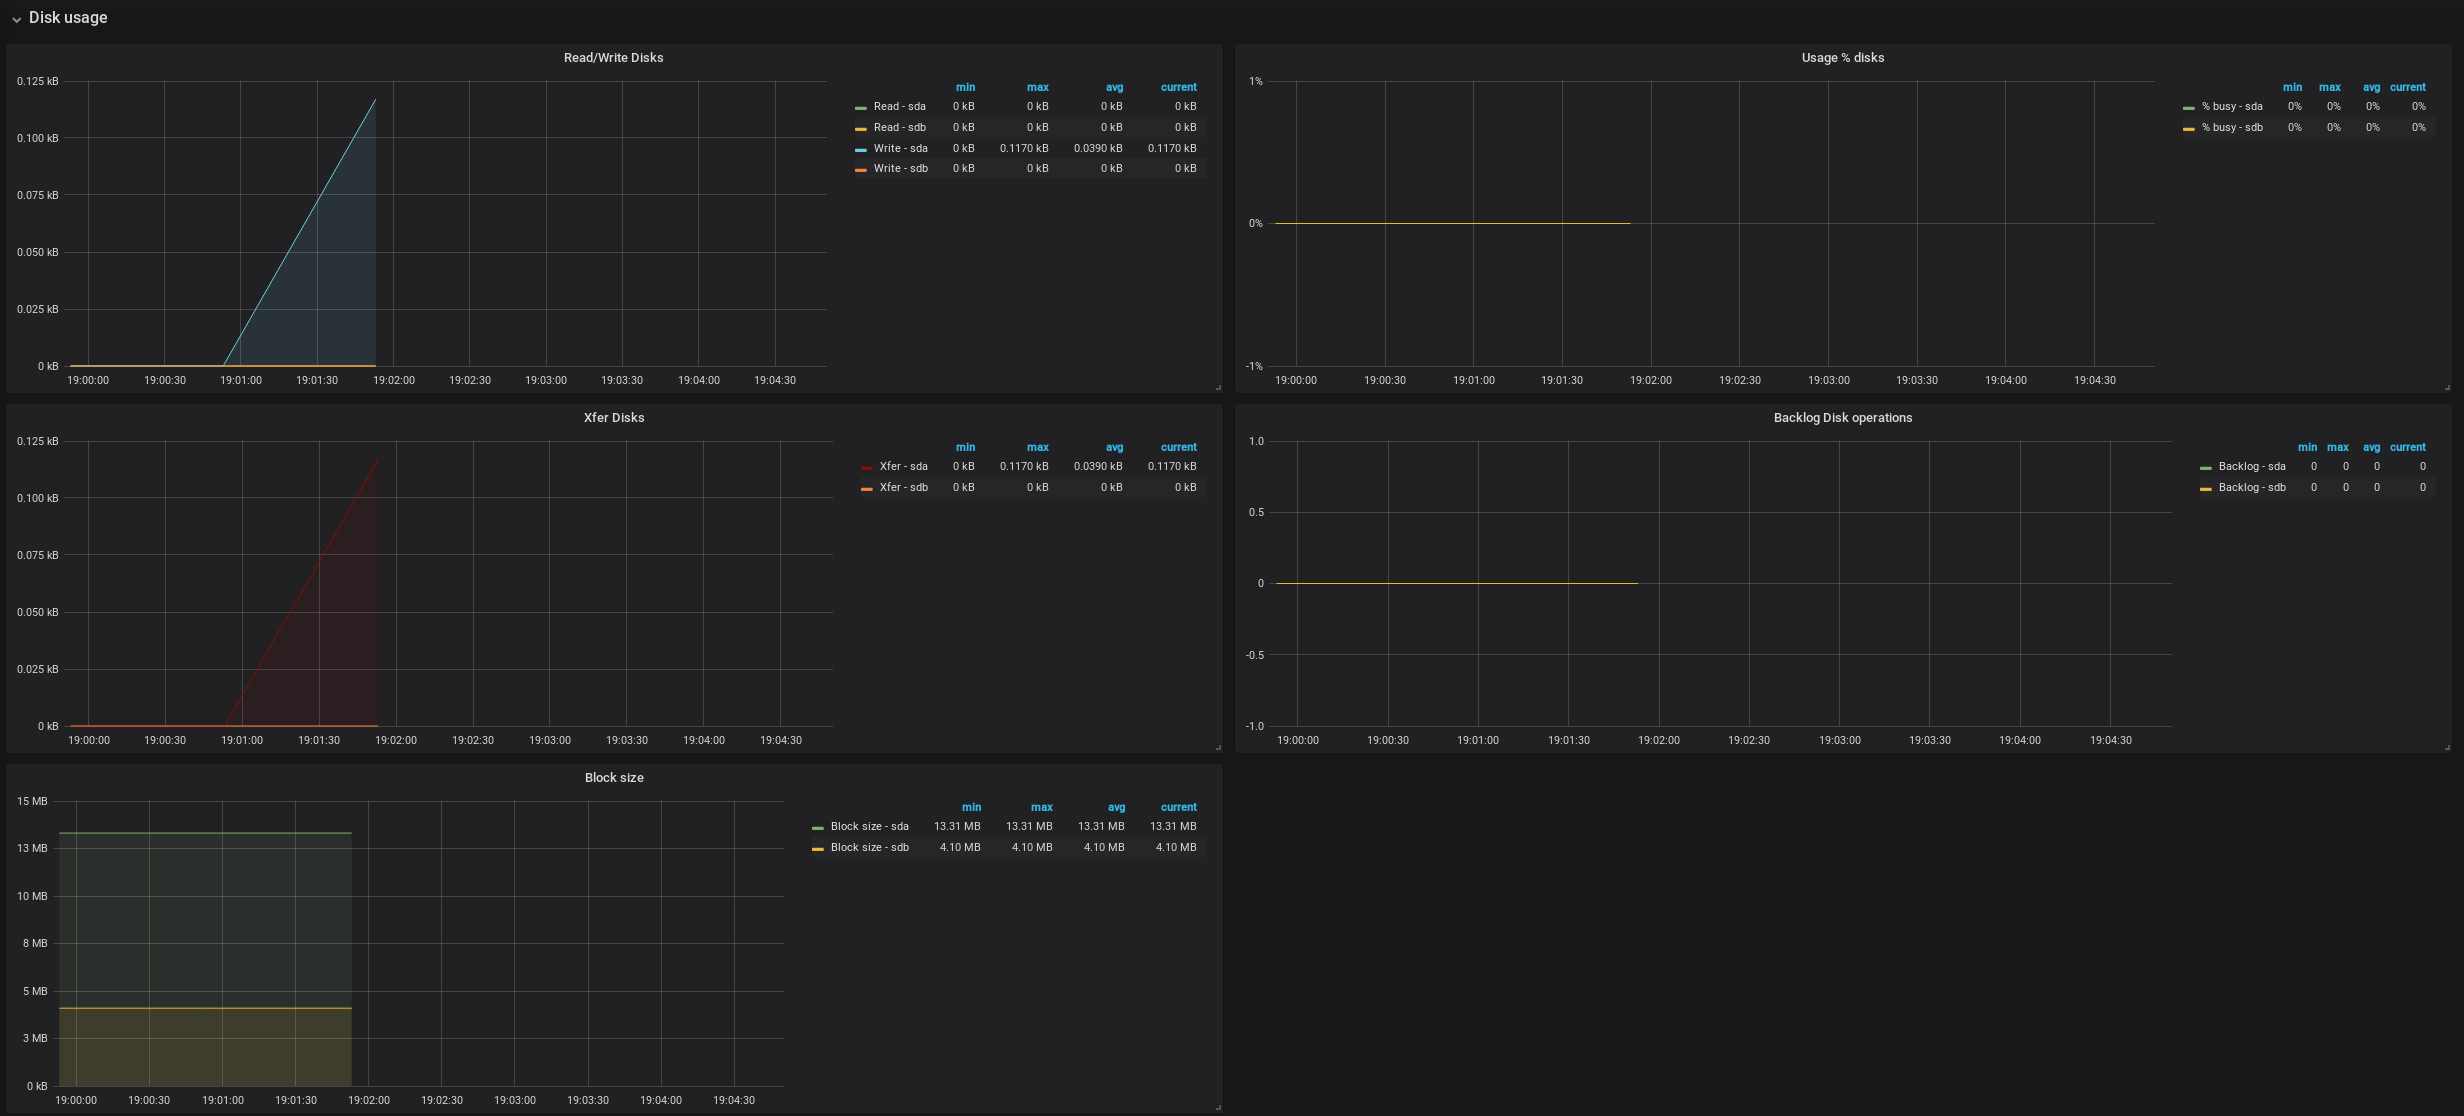
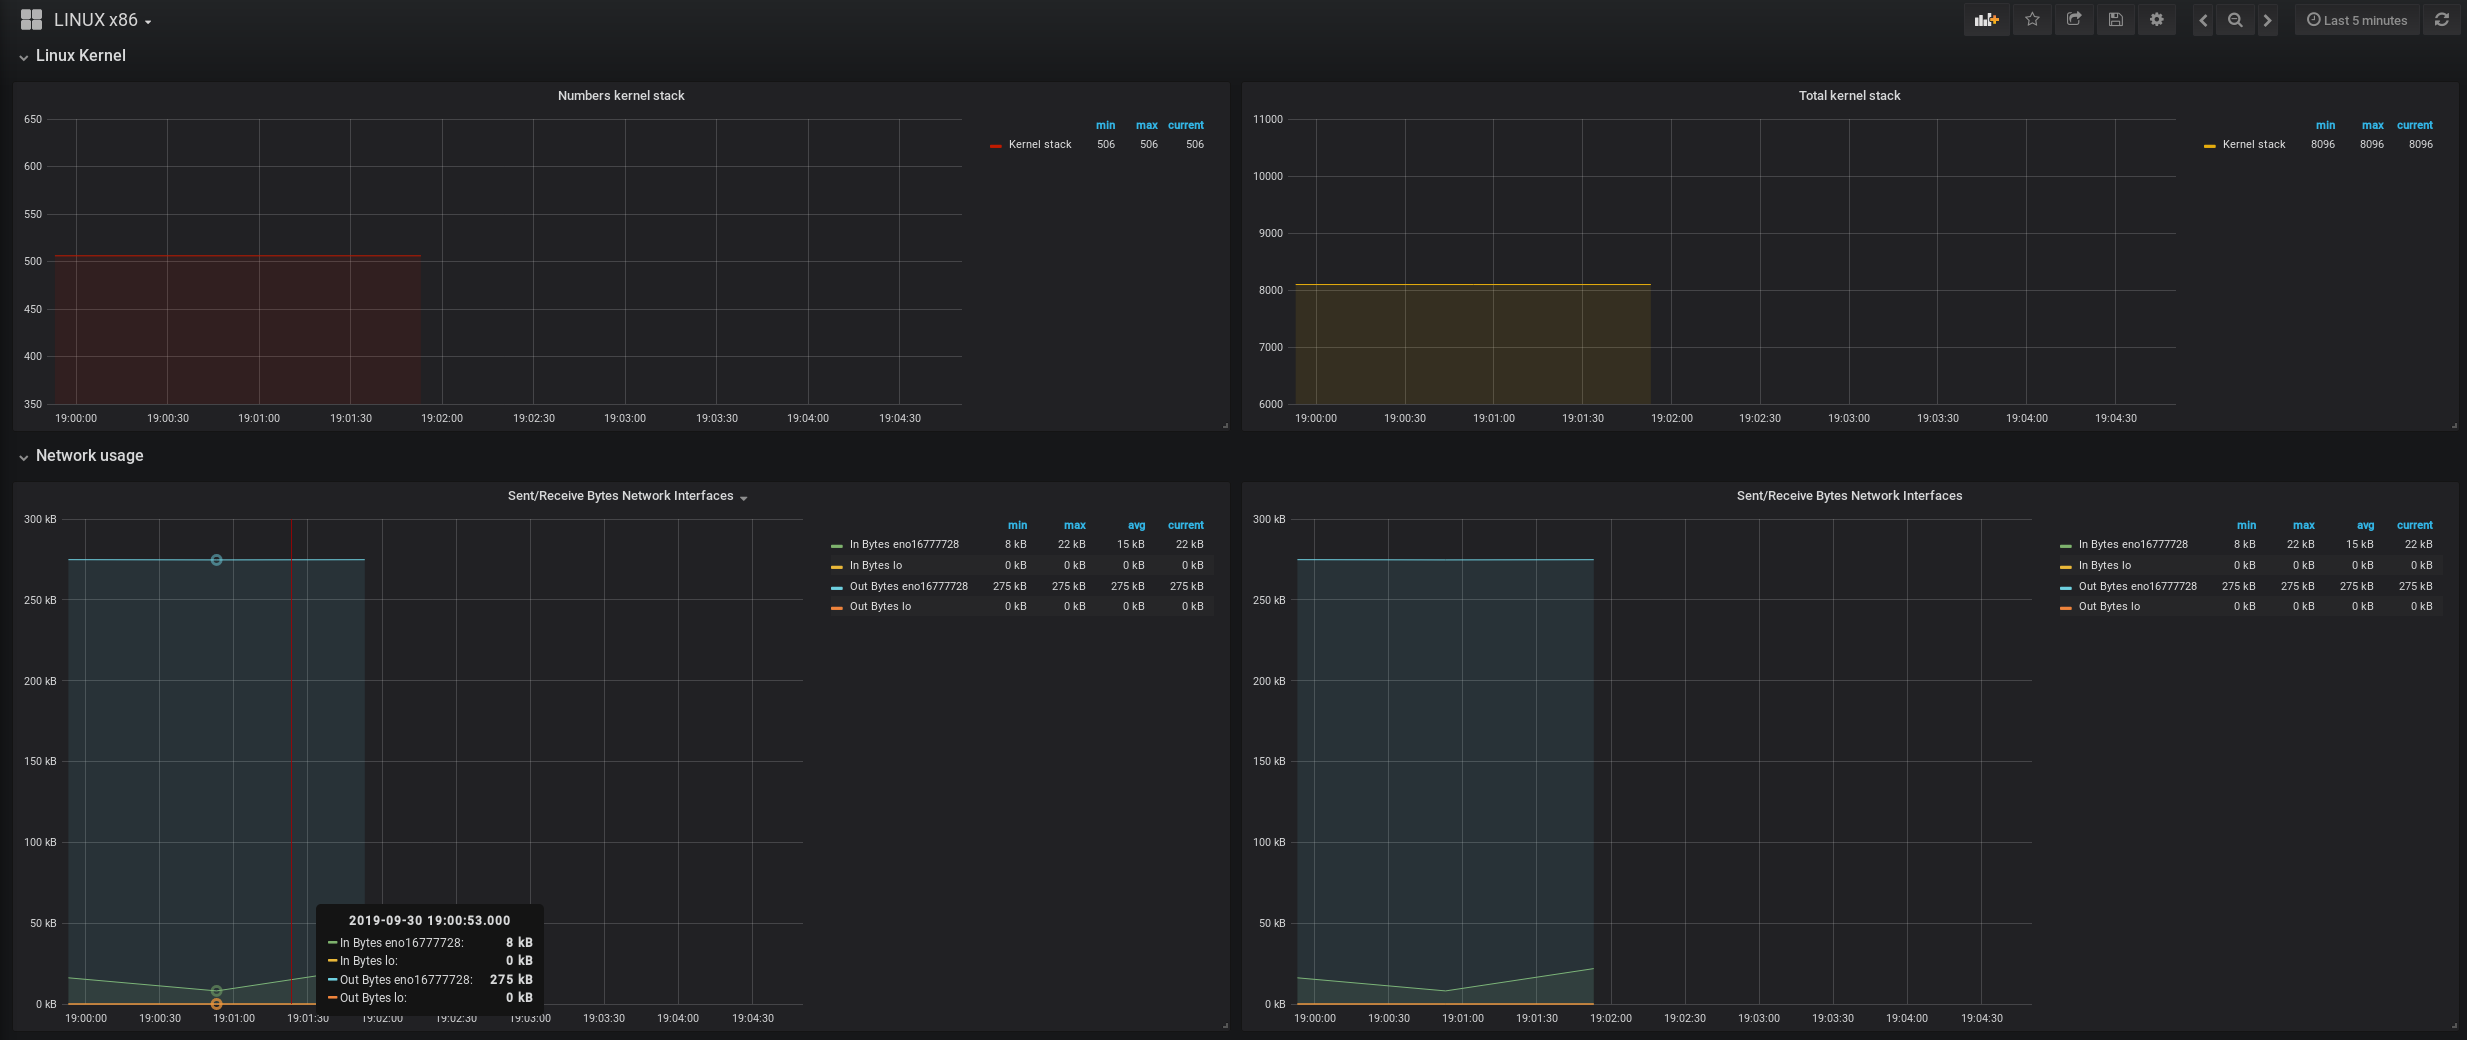
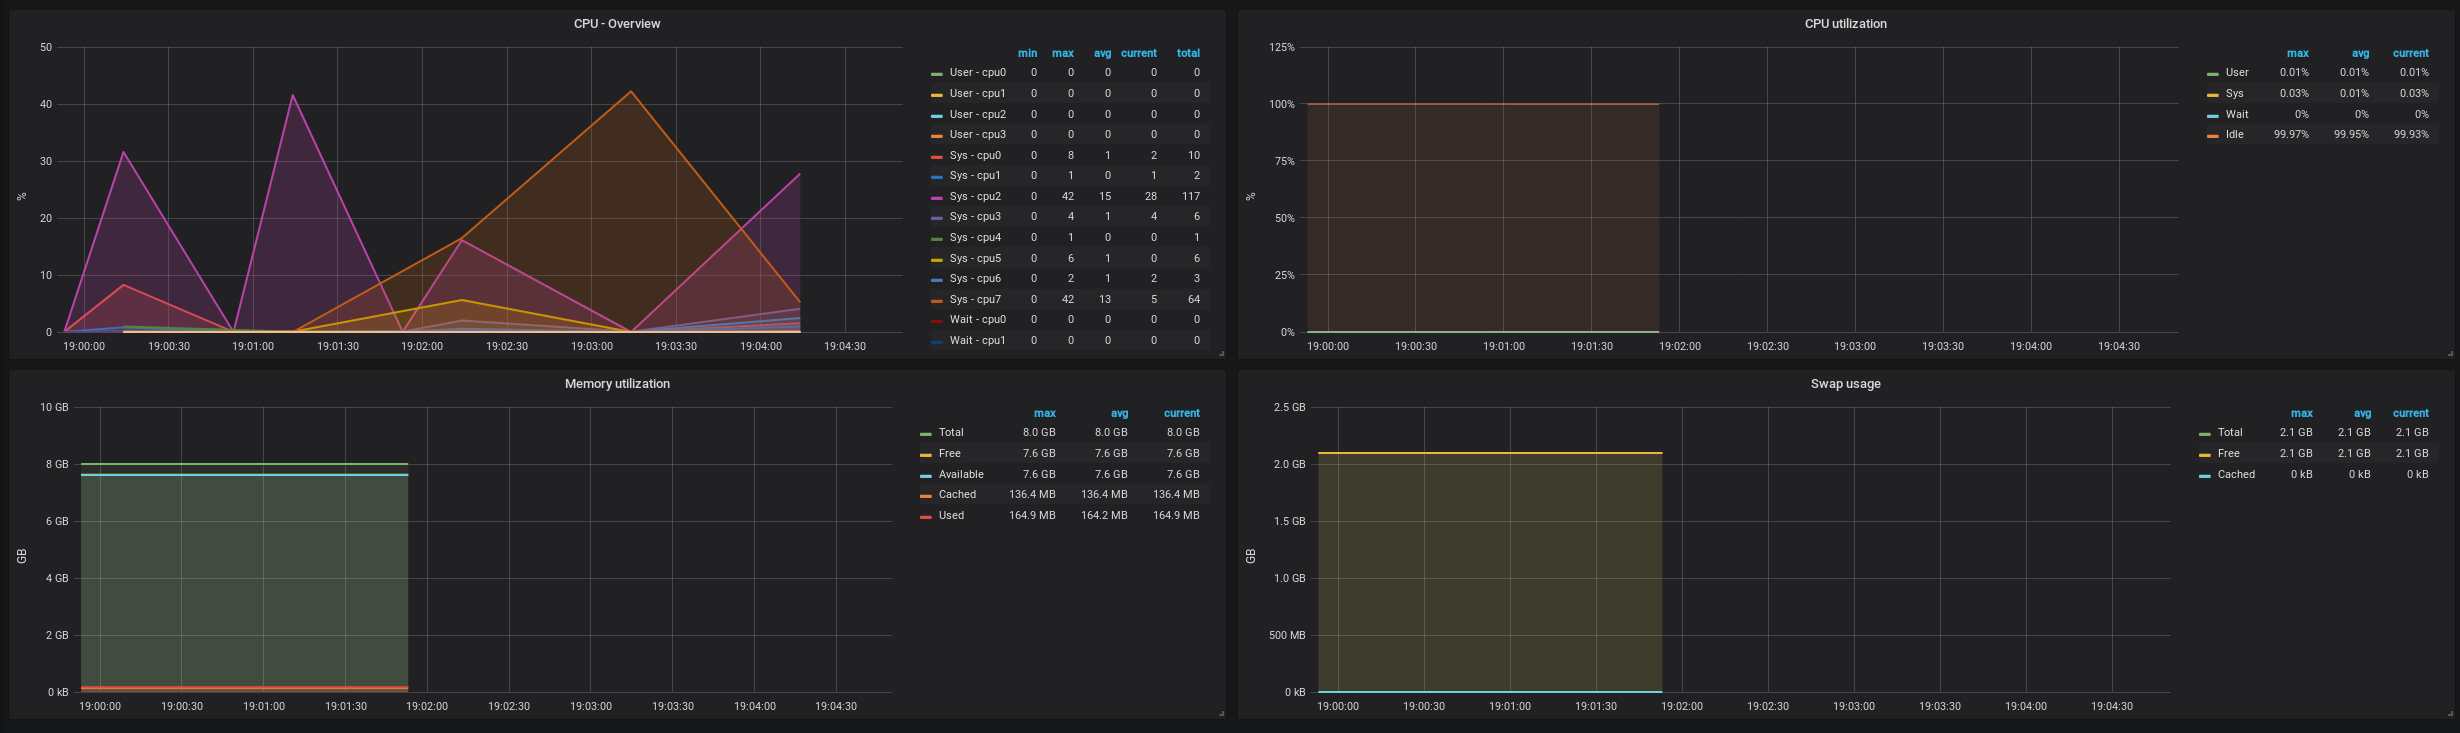
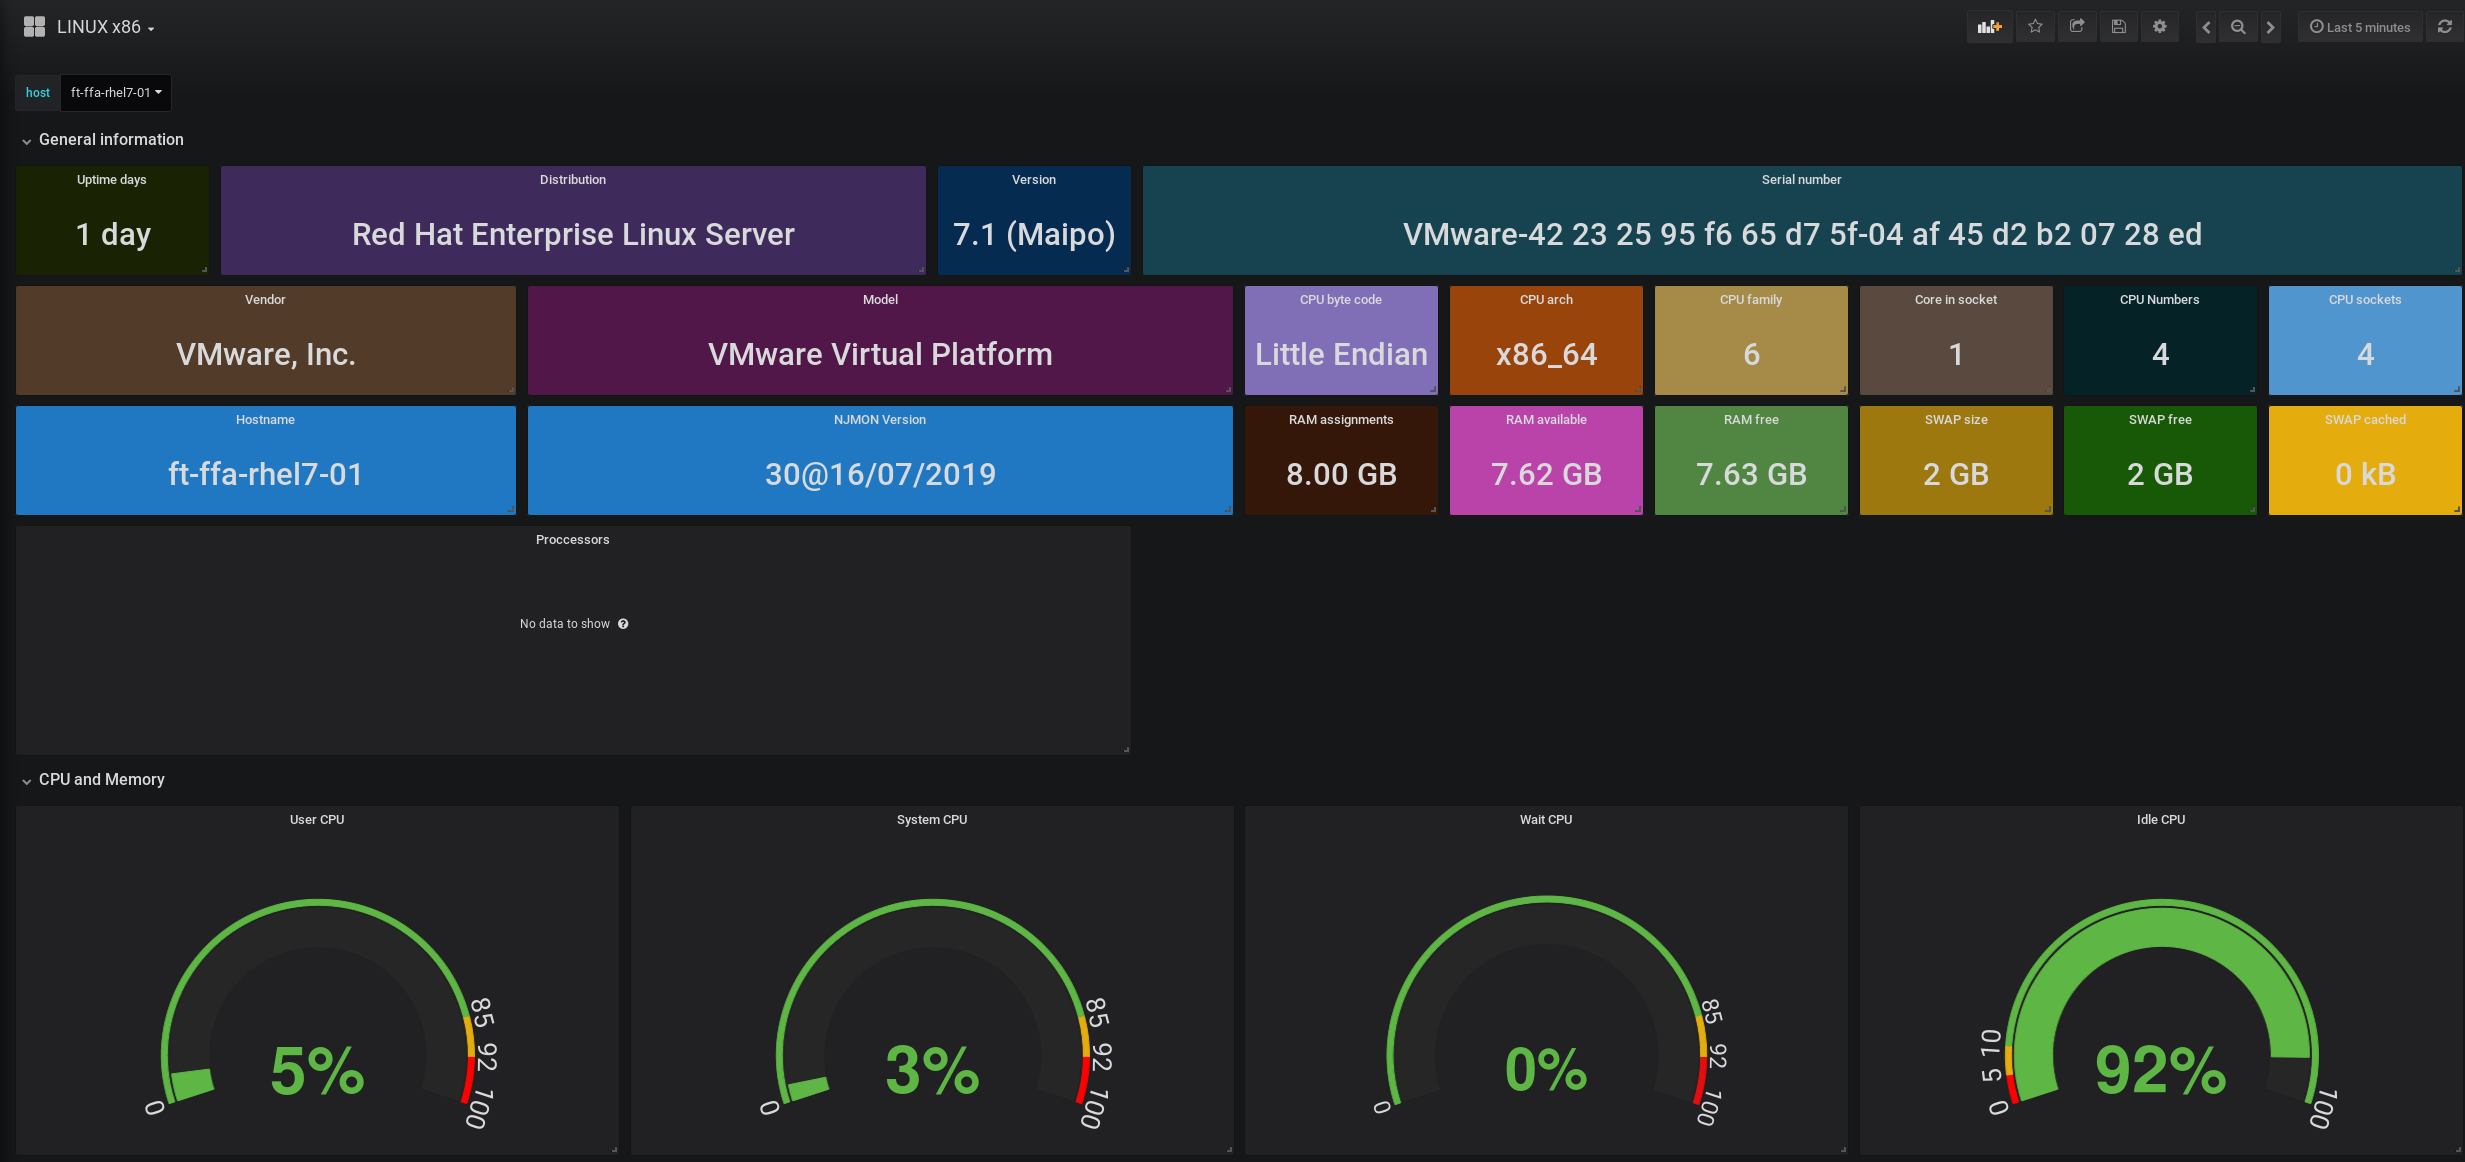
The LINUX x86 dashboard uses the influxdb data source to create a Grafana dashboard with the graph, singlestat and table panels.
Data source config
Collector type:
Collector plugins:
Collector config:
Revisions
Upload an updated version of an exported dashboard.json file from Grafana
| Revision | Description | Created | |
|---|---|---|---|
| Download |
Linux Server
Monitor Linux with Grafana. Easily monitor your Linux deployment with Grafana Cloud's out-of-the-box monitoring solution.
Learn more