FileWave System - With Network Load
Primary dashboard, overall system state
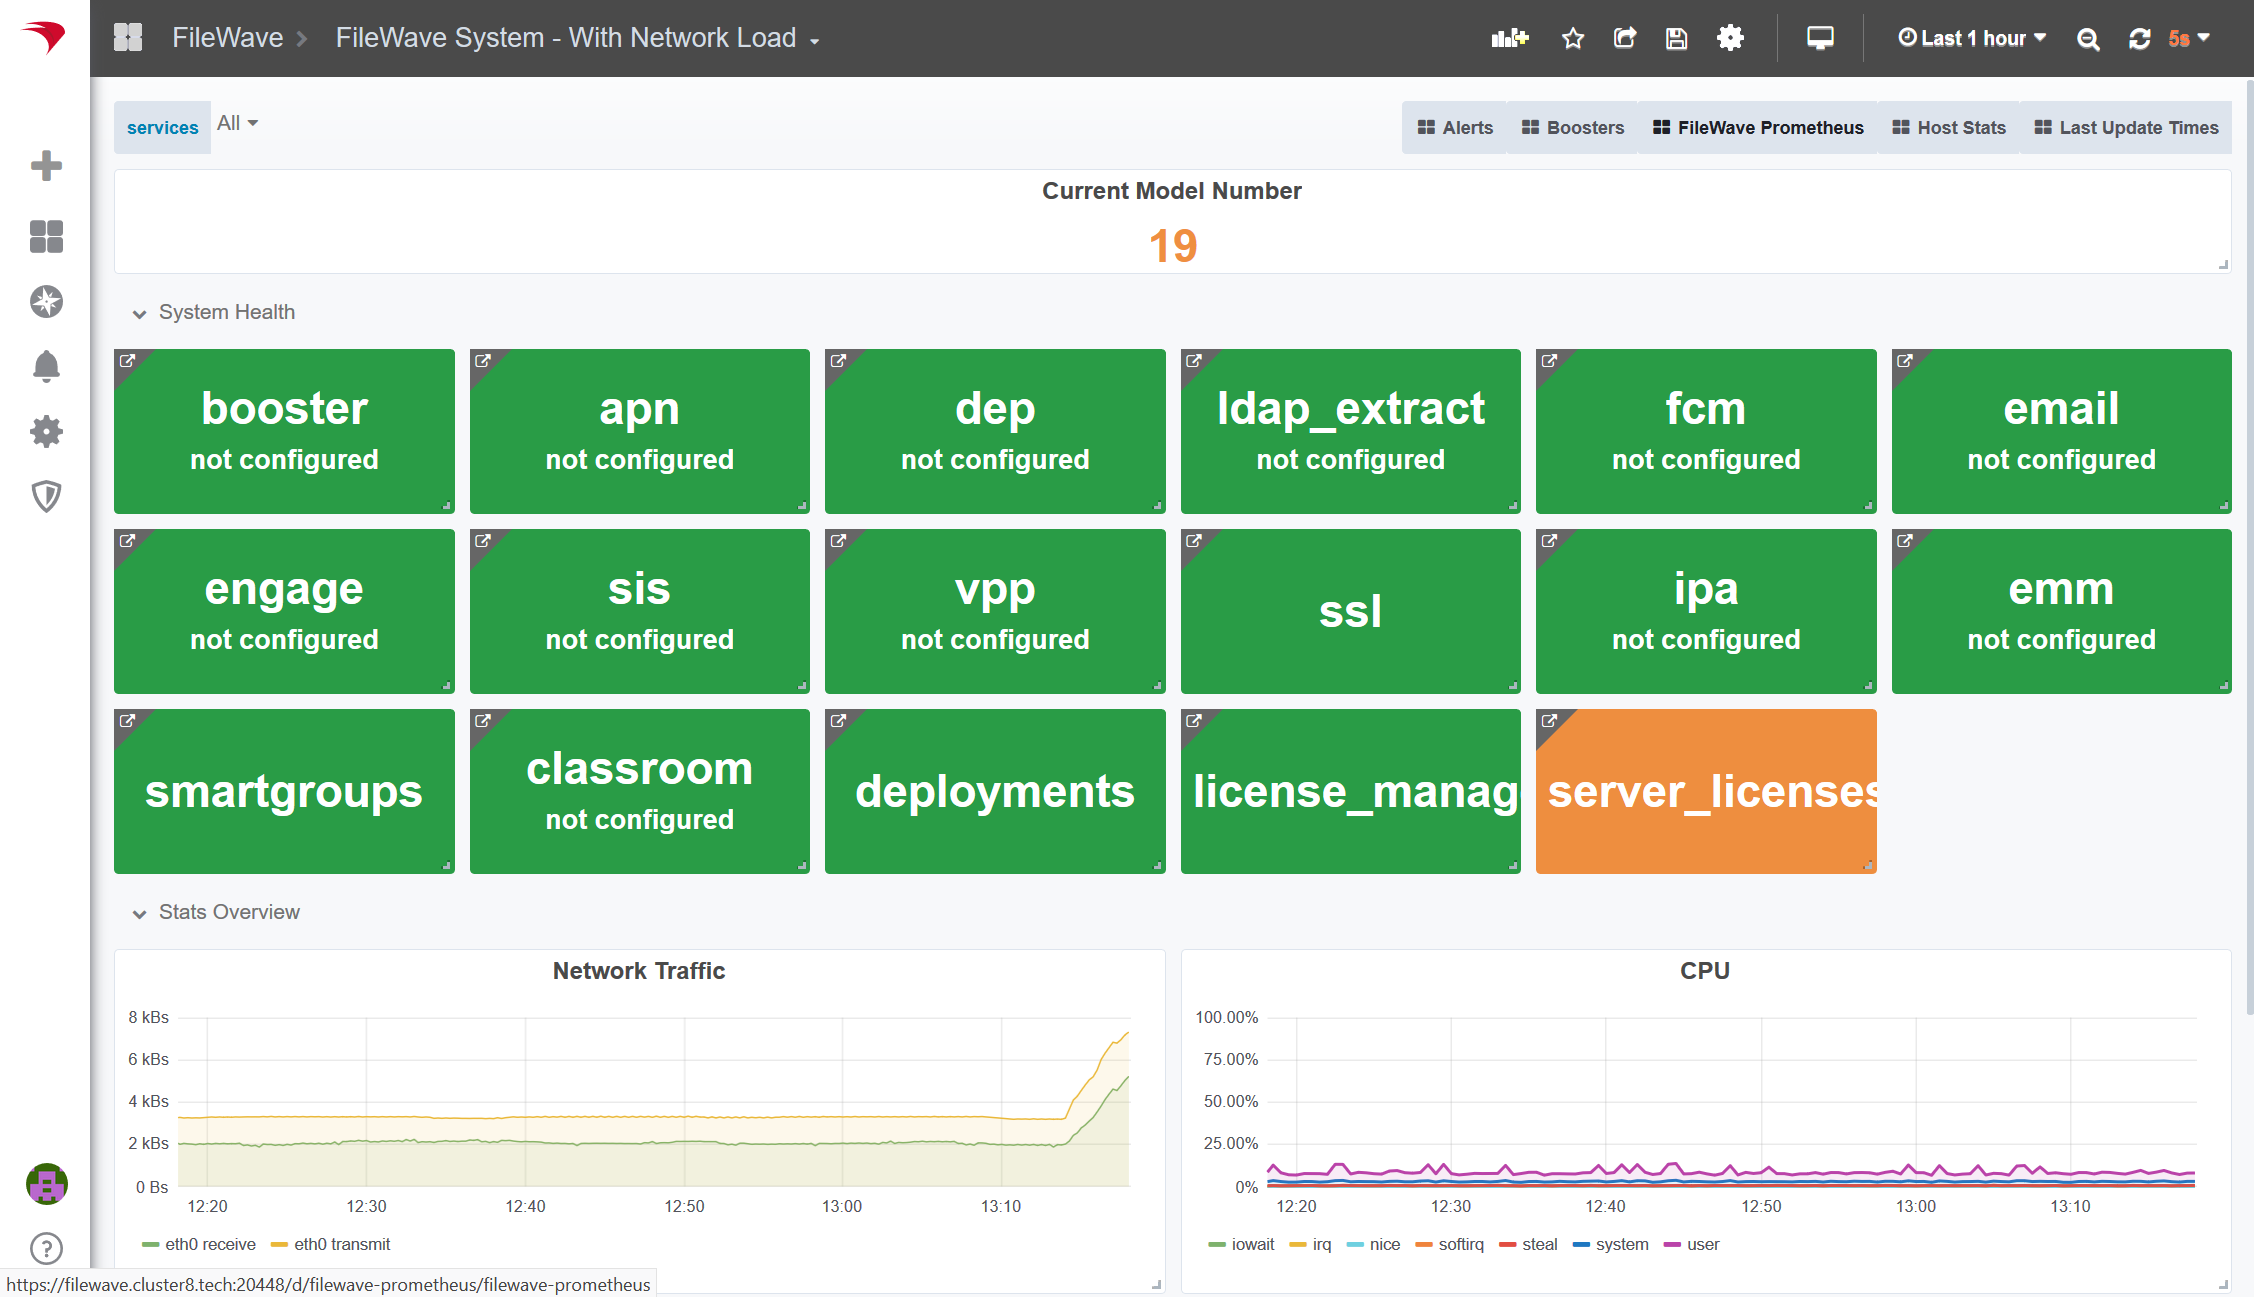
This shows the overall system configuration state, as well as simple networking, CPU and memory utilization. You can customize what status boxes are shown using the multi-select control.
Data source config
Collector type:
Collector plugins:
Collector config:
Revisions
Upload an updated version of an exported dashboard.json file from Grafana
| Revision | Description | Created | |
|---|---|---|---|
| Download |