Node exporter simple
Simple and clever dashboard for basic host metric (CPU, RAM, Free space, network). Cacti style)
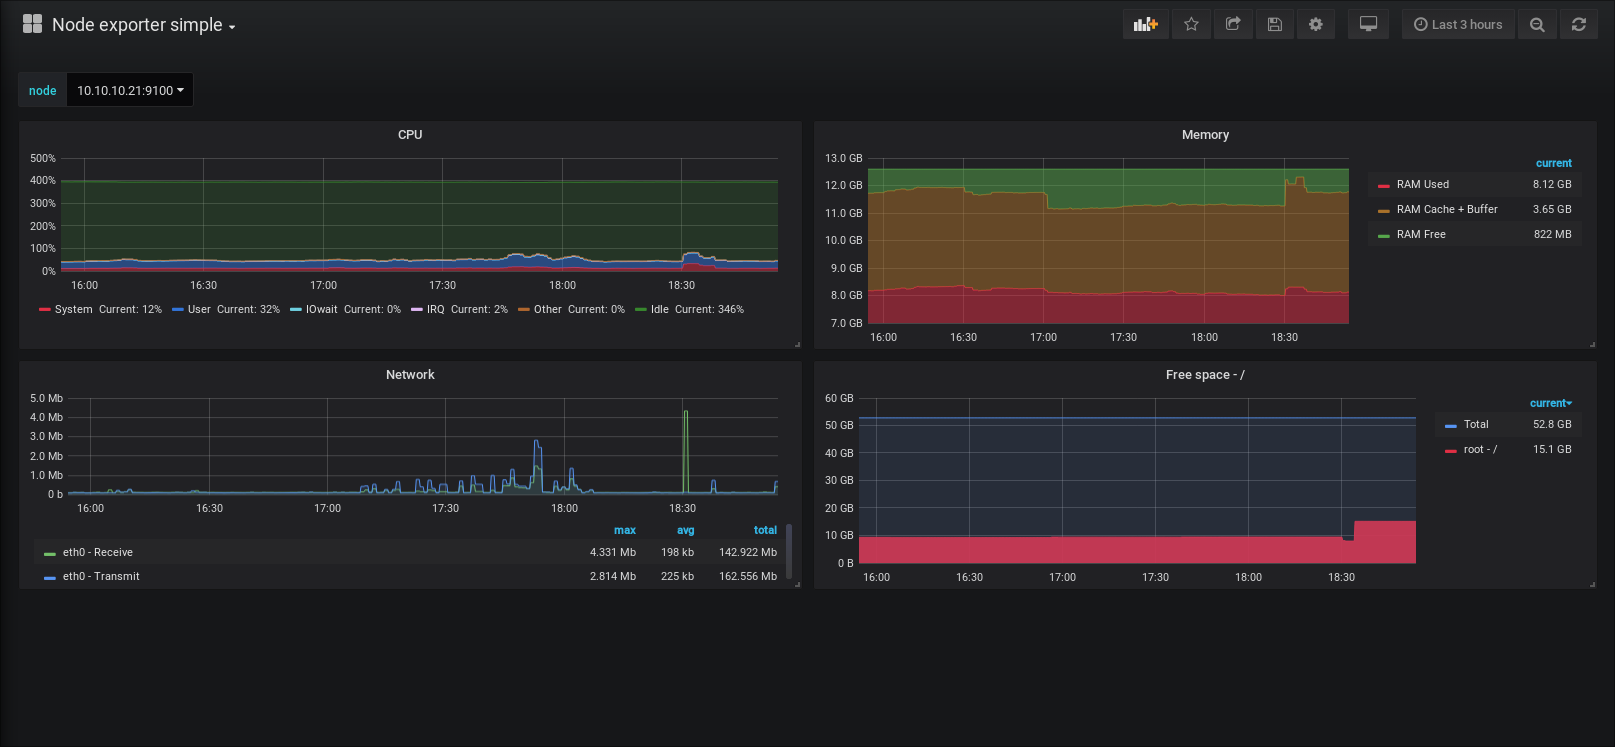
Simple and clever dashboard for basic host metric (CPU, RAM, Free space, network). Cacti style)
Data source config
Collector type:
Collector plugins:
Collector config:
Revisions
Upload an updated version of an exported dashboard.json file from Grafana
| Revision | Description | Created | |
|---|---|---|---|
| Download |
Linux Server
Monitor Linux with Grafana. Easily monitor your Linux deployment with Grafana Cloud's out-of-the-box monitoring solution.
Learn more