VictoriaMetrics - single-node
Overview for single-node VictoriaMetrics v1.117.0 or higher
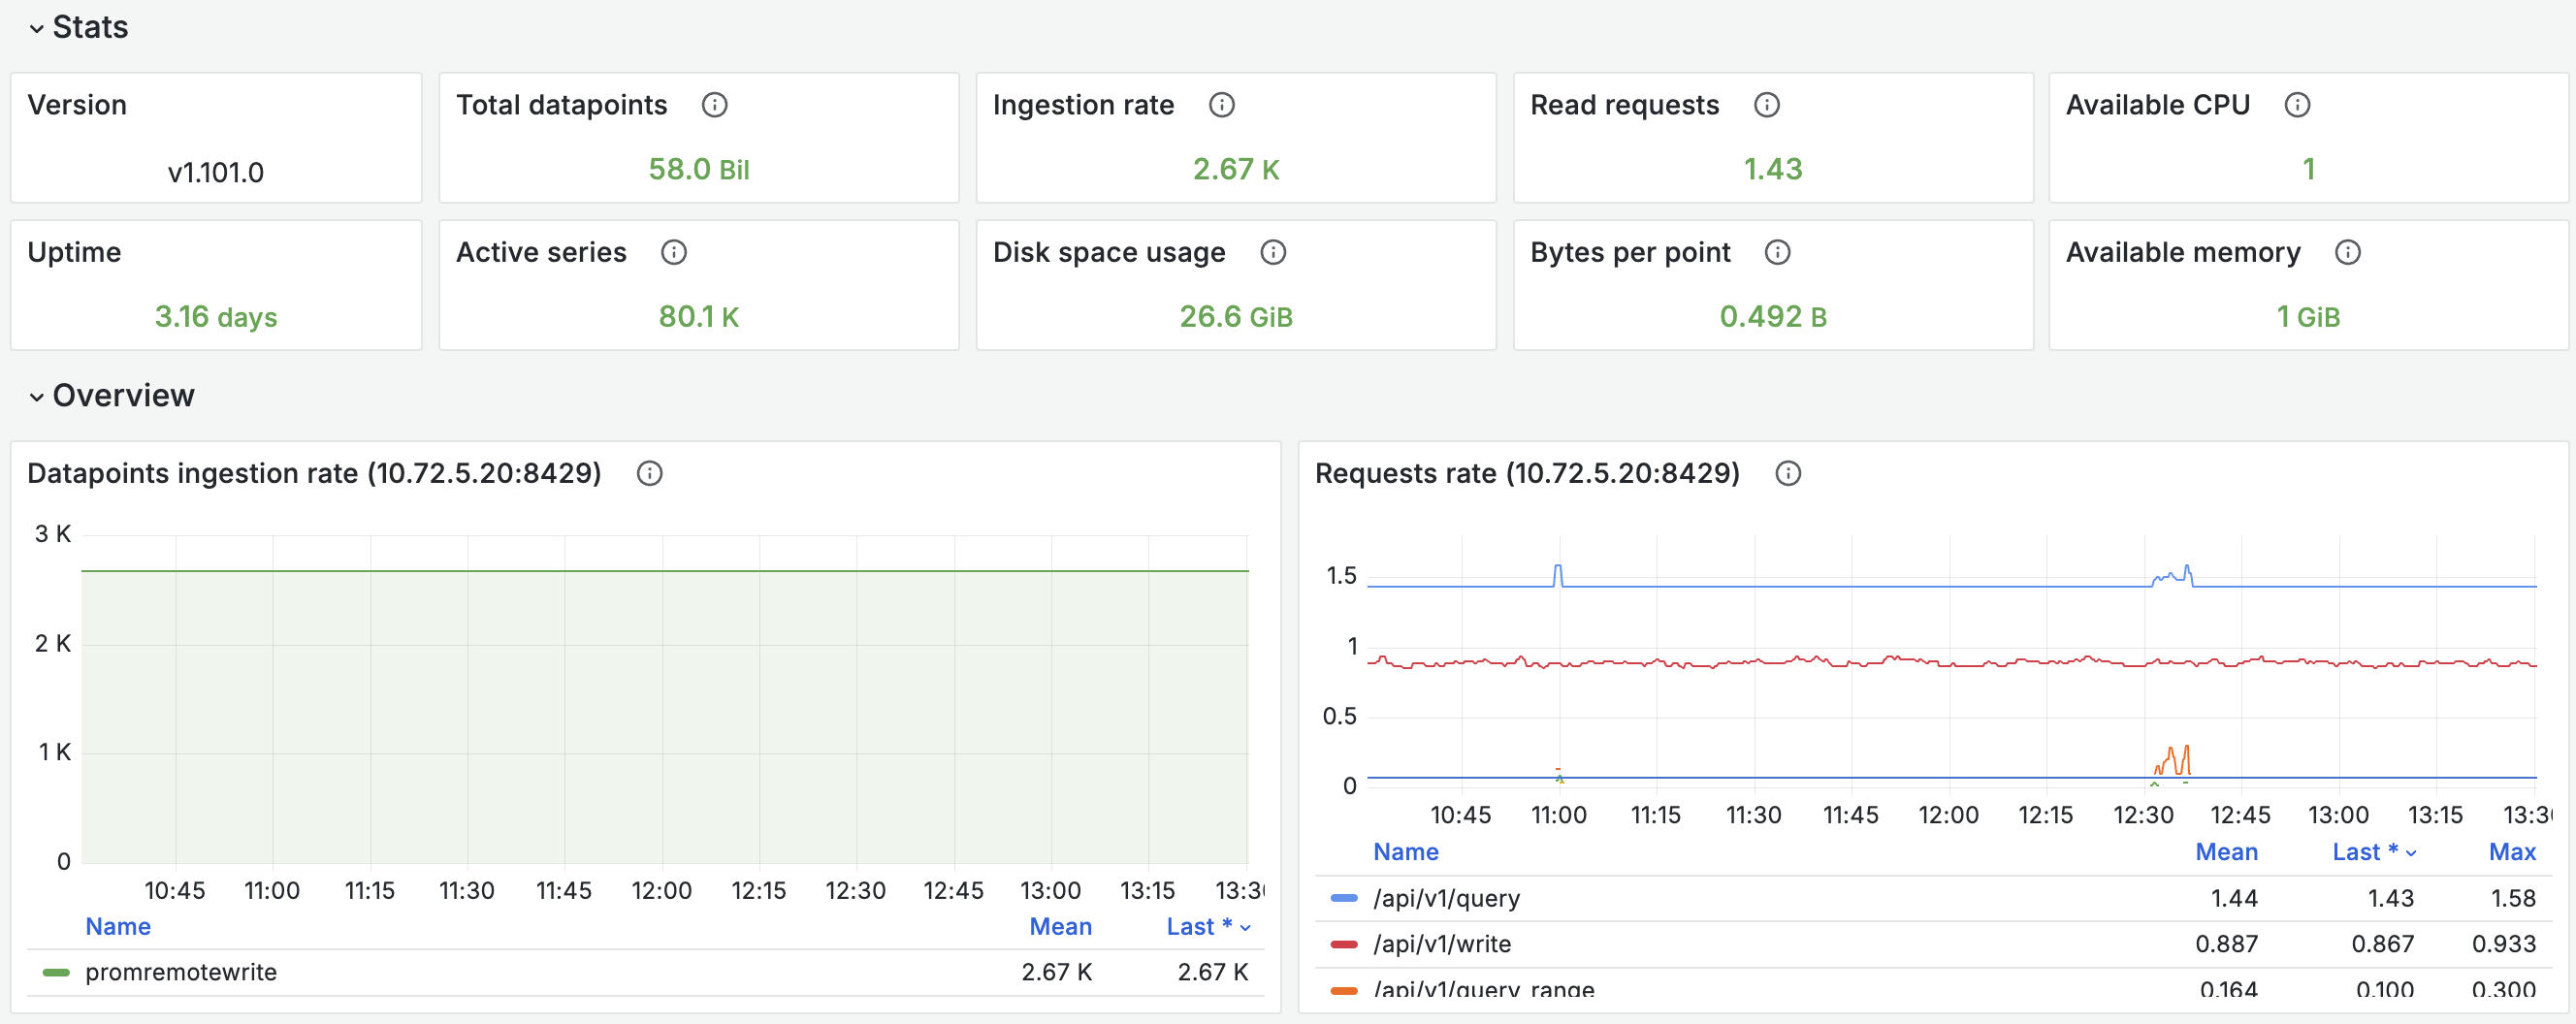
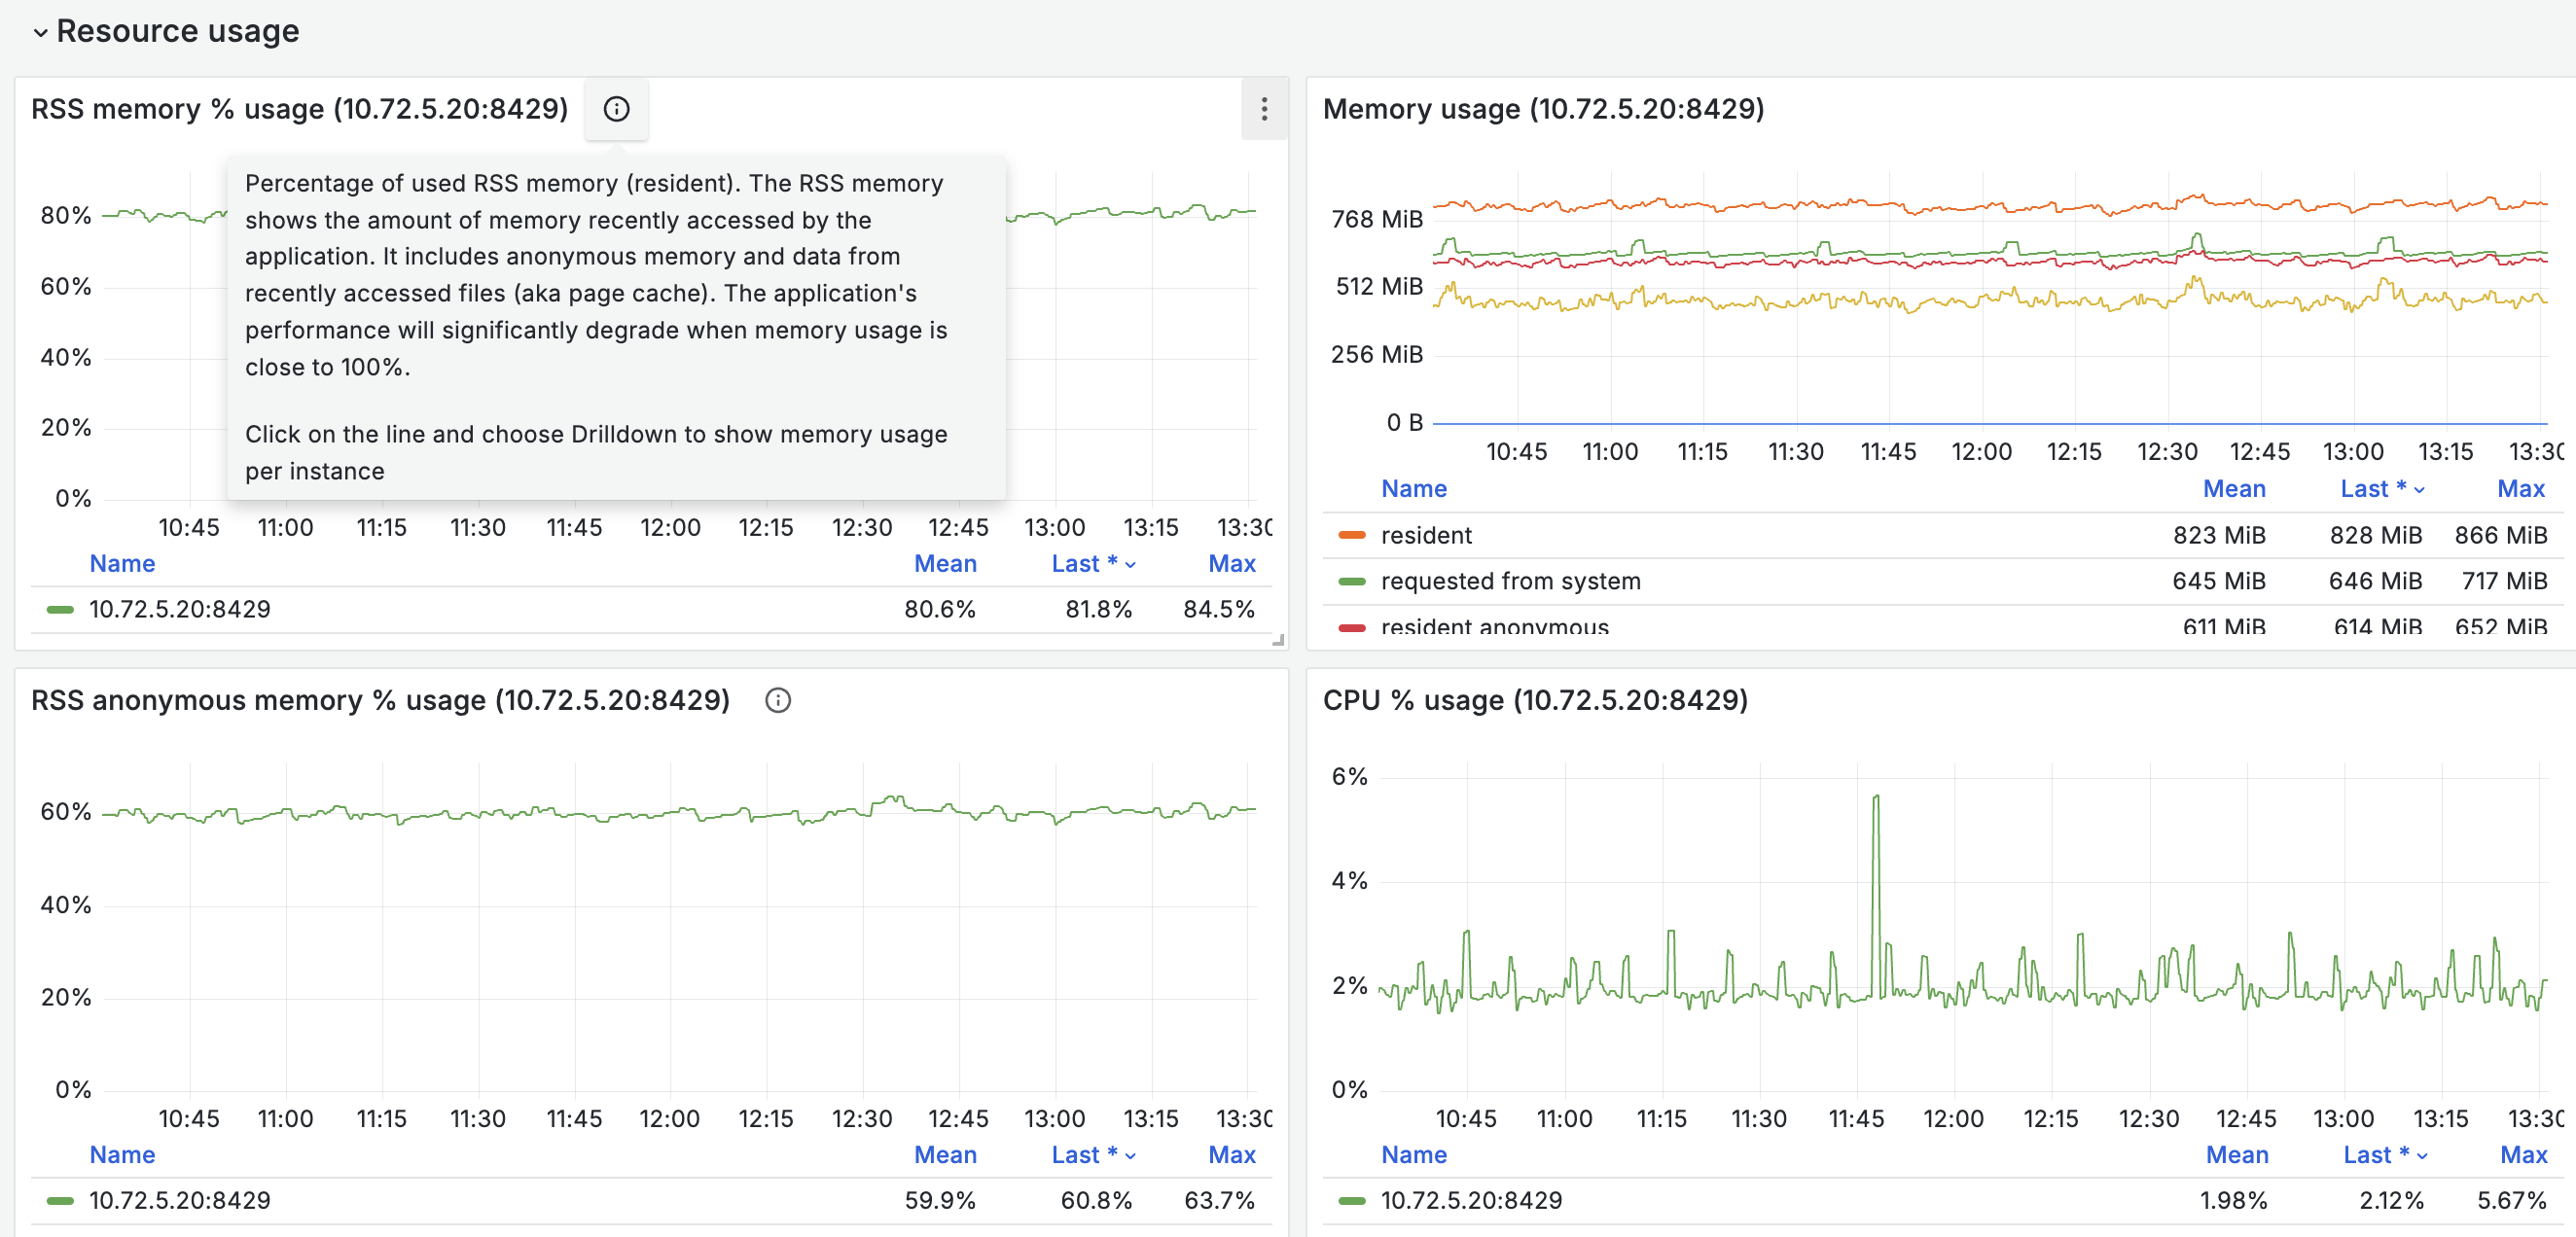
VictoriaMetrics single-server overview
Requirements
VictoriaMetrics: each revision may have different VictoriaMetrics version requirements.
Grafana: each revision may have different Grafana version requirements.
Use Prometheus datasource with this dashboard.
To scrape metrics configure VictoriaMetrics with -selfScrapeInterval flag or Prometheus job to scrape victoriametrics-addr/metrics address. More details about monitoring may be found here.
Description
The dashboard contains a visualization of the most useful metrics displaying the current state and performance of the service. If you have suggestions or improvements or found a bug - feel free to add issue or add a review to the dashboard.
More information about VictoriaMetrics.
Data source config
Collector config:
Upload an updated version of an exported dashboard.json file from Grafana
| Revision | Description | Created | |
|---|---|---|---|
| Download |
Linux Server
Monitor Linux with Grafana. Easily monitor your Linux deployment with Grafana Cloud's out-of-the-box monitoring solution.
Learn more
