Navigating observability costs: how to manage the tradeoff between cost and coverage for observability logs
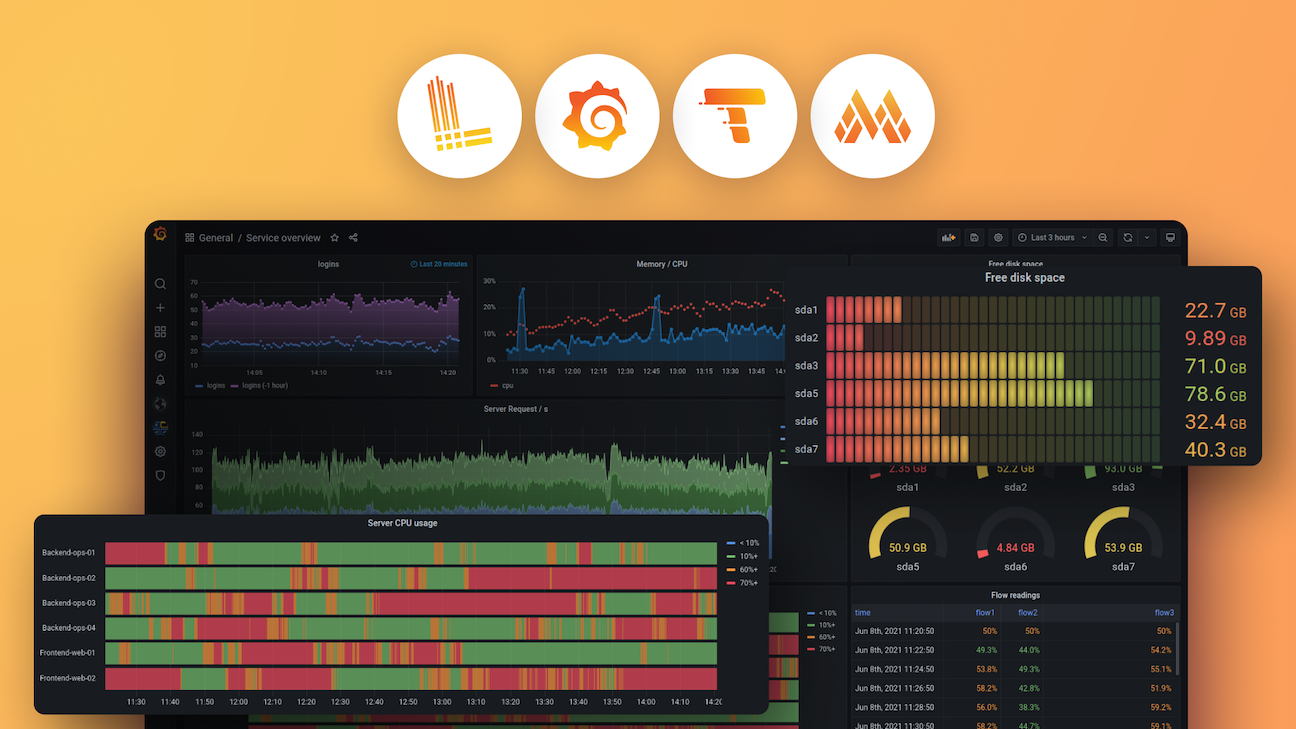
Logs have always been, and continue to be, a critical part of the troubleshooting workflow for observability and SRE teams. But the reputation of legacy solutions being expensive on budgets and resources – for storing and querying – results in teams making tradeoffs on which services and applications to instrument logging. This creates observability blind spots. Learn how Grafana Loki can help you optimize multiple stages of your logging lifecycle – from supporting multiple log formats and smaller indexing, to blazing fast querying and long-term retention. Uniquely built on Prometheus architecture, Grafana Loki is a cost-effective logging solution purpose built for observability.
Our commitment to the open-source community knows no boundaries. We host this webinar series across various timezones to connect with users worldwide. Explore the same content by Grafana Labs team members in your timezone:
Additional resources to explore:
Your guide
