
What you'll learn
- Why log volume and cost explode in cloud-native environments
- How Adaptive Logs helps drop low-value log volume before it hits your bill
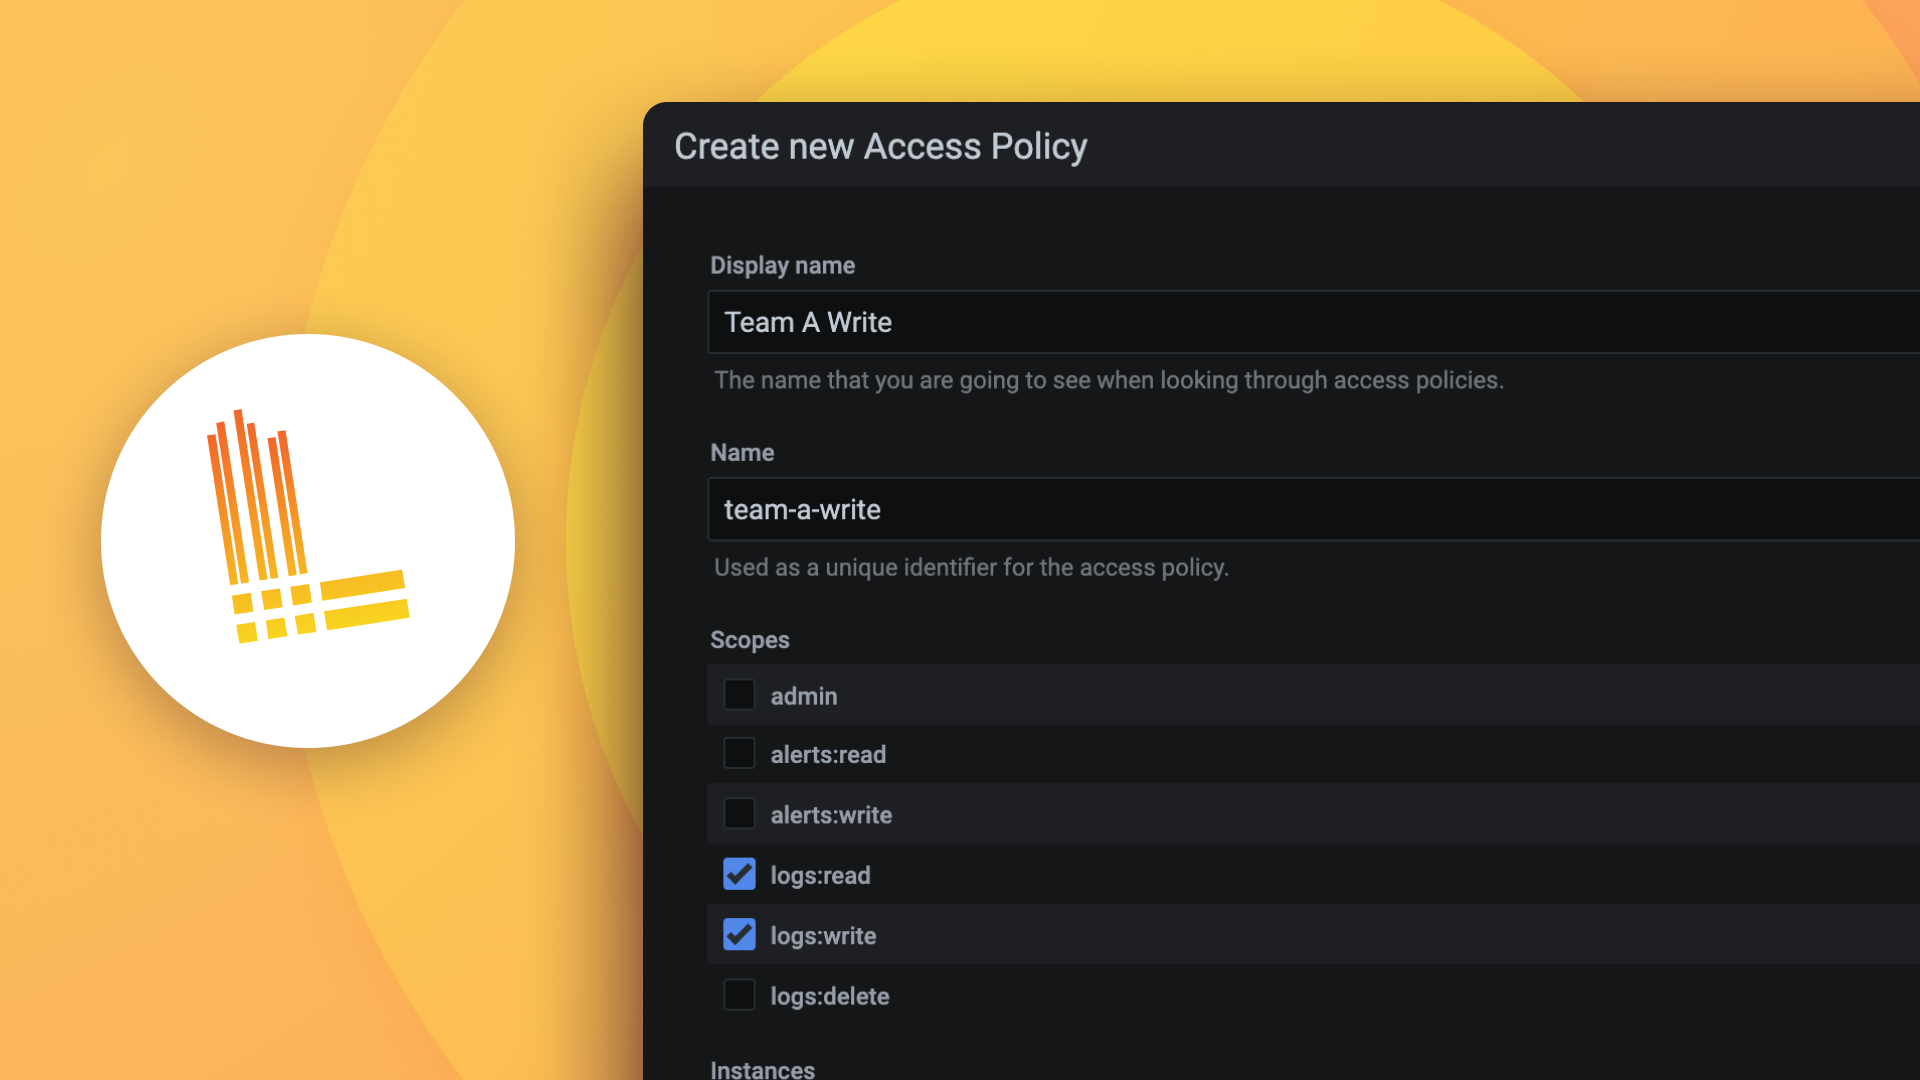
- How to share logs safely across teams with RBAC and label-based access control (LBAC)
- How Grafana Assistant helps investigate incidents and explain log patterns faster
- What’s new in modern Loki / Cloud Logs (OTLP ingestion, structured metadata) and how to get started on Grafana Cloud
Scalable Logging with Grafana Loki
Cloud-native and microservices architectures generate far more logs than traditional systems. As volume grows, many teams hit the same wall: logging gets expensive, queries slow down, and existing tools don’t connect cleanly to metrics.
Grafana Loki was built for that problem. Instead of indexing every log line, Loki indexes the metadata around your logs. That keeps it fast, cost-effective, and highly scalable. Because it uses the same service-discovery model as Prometheus, your logs share consistent labels with your metrics — so you can move between metrics and logs without losing context.
Grafana Cloud Logs gives you a managed Loki experience when you want a turnkey path. You can control cost with Adaptive Logs by reducing low-value volume before it hits your bill, share logs securely across teams with role-based and label-based access controls, and investigate faster with Grafana Assistant — from writing queries to explaining noisy patterns during incidents.
Whether you’re self-managing Loki or running on Grafana Cloud, this session covers how to scale logging without giving up performance, security, or insight.