What you'll learn
- Gain real-time insights into user interactions with Grafana Cloud Frontend Observability
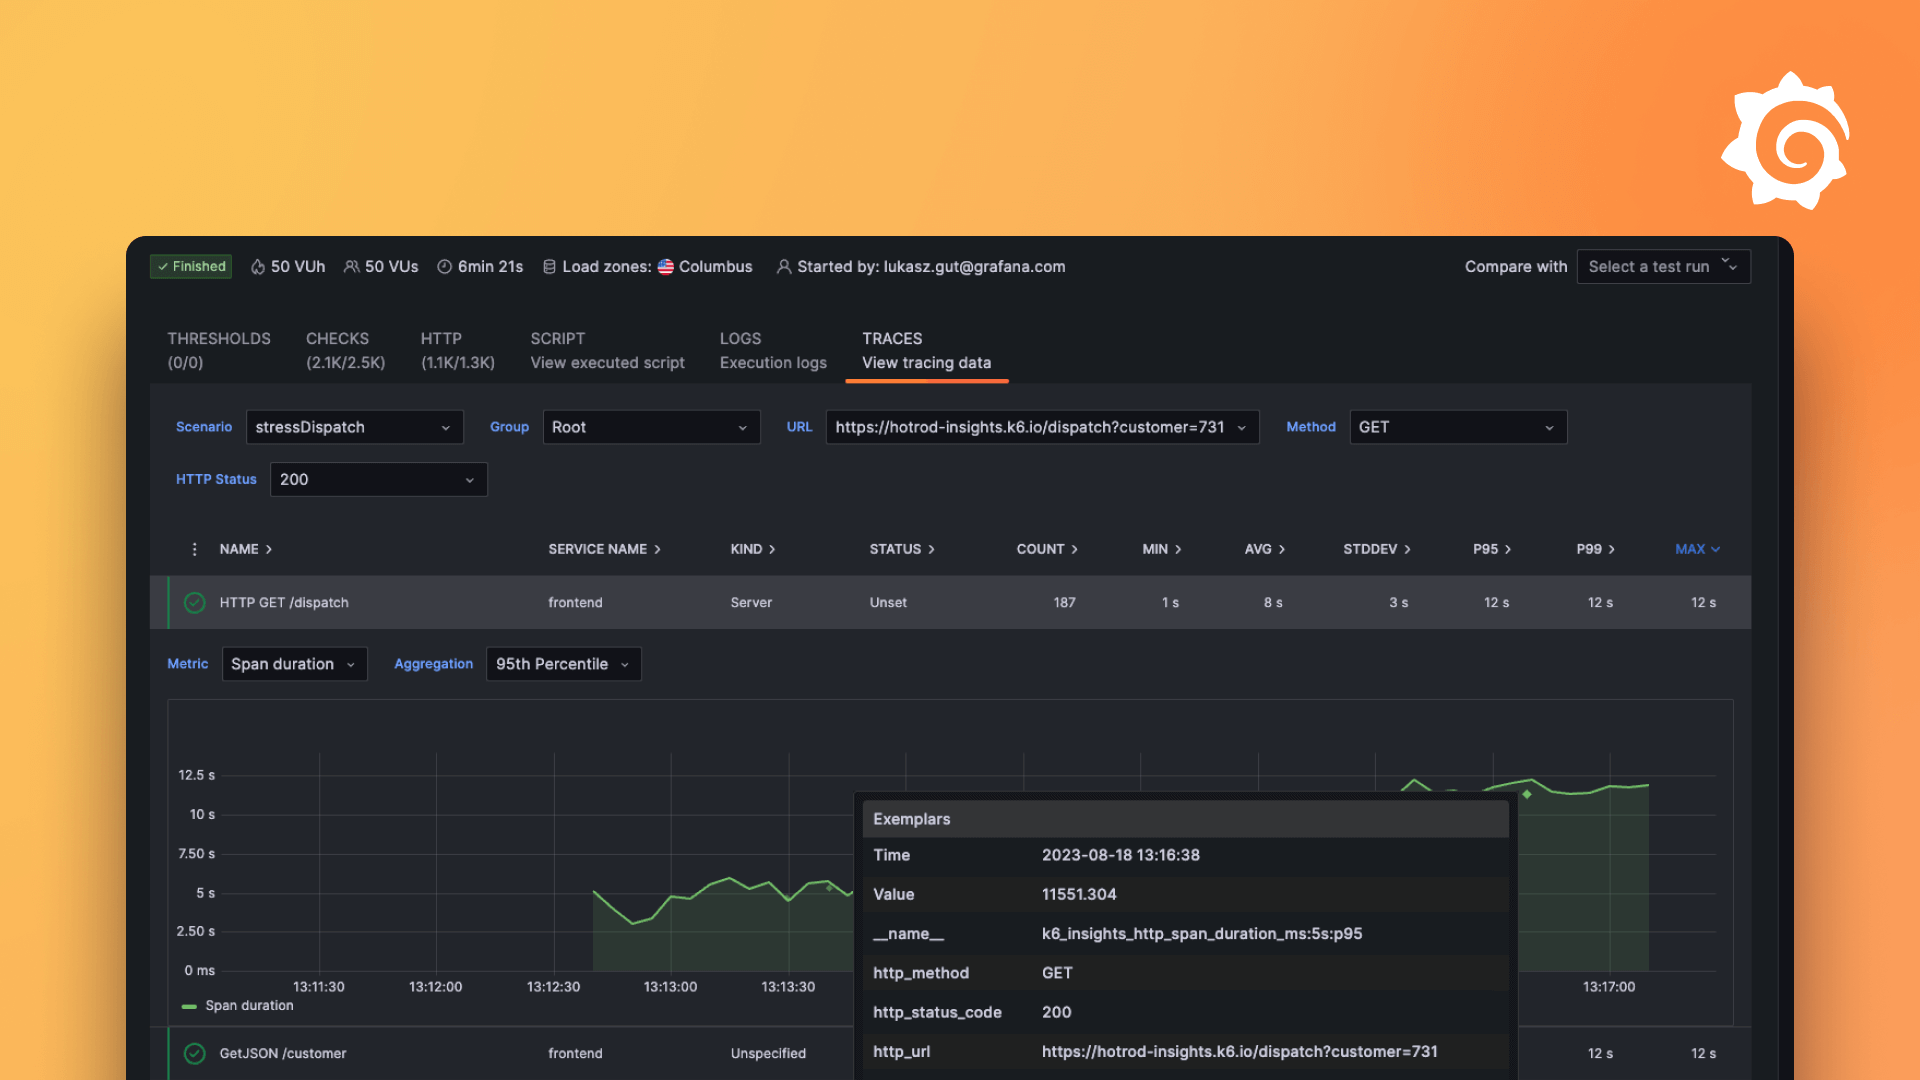
- Proactively performance test key user flows with Grafana Cloud k6
- Continuously validate those same flows in production with Grafana Cloud Synthetic Monitoring
- Connect testing and observability in one place
From real-user monitoring to load tests and production synthetics. See how Grafana Cloud k6, Frontend Observability, and Synthetic Monitoring work together, with AI-assisted script authoring when you need it.
In today’s fast-paced digital landscape, ensuring a smooth and reliable end user experience is critical. Join us to explore how Grafana’s suite of observability tools—Grafana Cloud k6, Frontend Observability, and Synthetic Monitoring—helps engineering teams test, monitor, and optimize user journeys across the software lifecycle.
Best of all, you’ll learn how to reuse the same k6 test scripts across performance testing and synthetic monitoring, streamlining workflows across development, QA, and production.
Whether you’re focused on frontend development, QA, or production reliability, this webinar will show how Grafana provides full visibility into your most critical user experiences.
Your guide

Mark Covello
Solutions Engineer
Grafana Labs