What you'll learn
- Best practices to manage cardinality explosion with Grafana
- How to drop unused labels and metrics in a cloud native environment
- How to proactively monitor for high cardinality through Grafana dashboards, reporting, and alerts
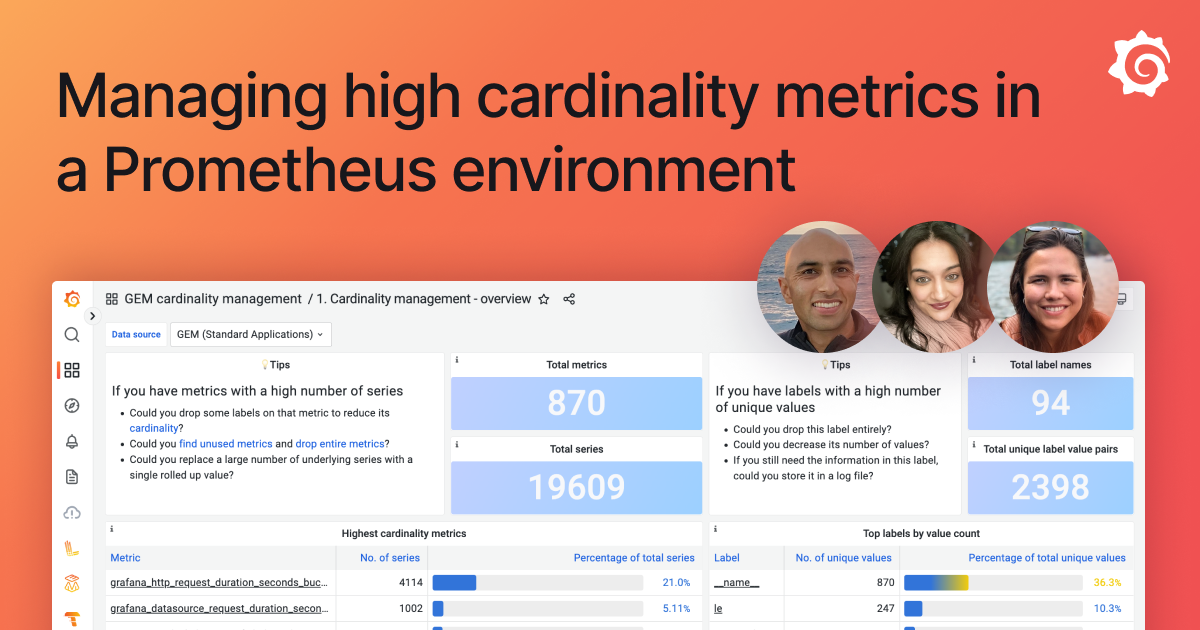
The impact of high cardinality can manifest as slow degradation to query performance or increasing data costs to store and retrieve metrics. And that leads to this conundrum: How do you optimize cost and performance without sacrificing relevant and critical data? This webinar will focus on answering the most common questions behind high cardinality: what are the pros and cons, why it has become a challenge to SRE teams today, and what steps to take to tame your high-cardinality environment.
Additional resources to explore:
Your guides

Archana Kesavan
Director, Product Marketing

Jen Villa
Director of Product
Grafana Labs
