What you'll learn
- Learn what is Grafana Loki and what it does
- Get a high level overview of how Loki works, what makes it different, and what it’s good at
- See a demo of new and updated Loki 3.0 features so you can learn how to create metrics from logs and alert on your logs with powerful Prometheus-style alerting rules
Loki is a horizontally scalable, highly available, multi-tenant log aggregation system inspired by Prometheus.
Grafana’s Loki open source project for logging aggregation has seen a great uptick in adoption by users benefiting from its small index, ease of use, and cost-effectiveness. Enterprises like Grofers and Paytm Insider are using Loki in both Grafana Labs’ hosted offering and on premise. And with recent Grafana Loki releases, we’ve made big gains for improving performance through parallelization and query optimization.
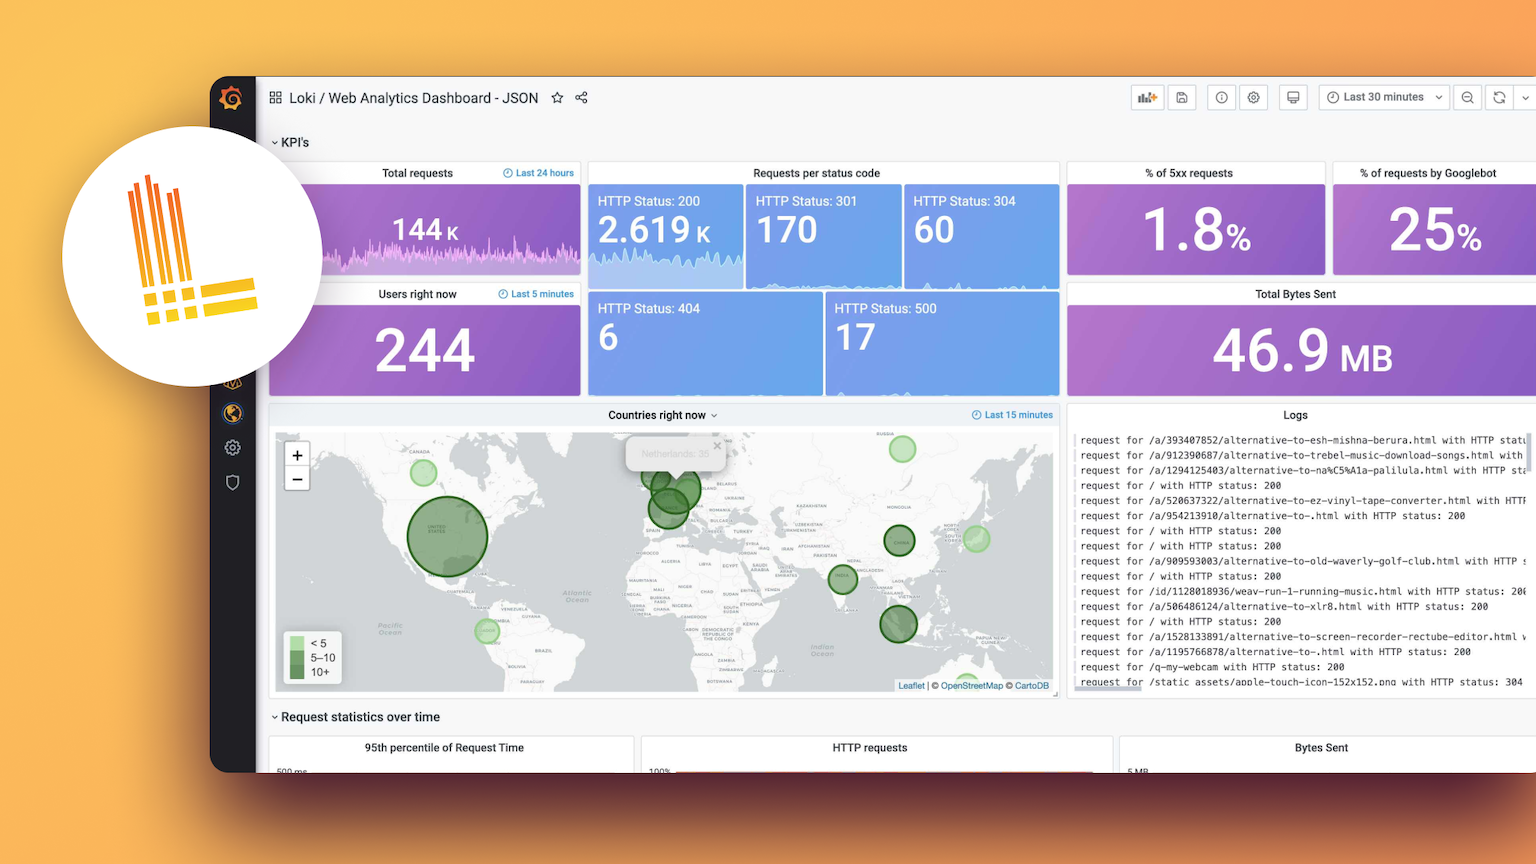
In this webinar you’ll hear about the key benefits of Loki 3.0 and get a live demo of the set of query language features that lets you extract more labels at query time to allow for query possibilities only limited by your imagination! You’ll also learn how to create metrics from logs and alert on your logs with powerful Prometheus-style alerting rules.
Your guide

