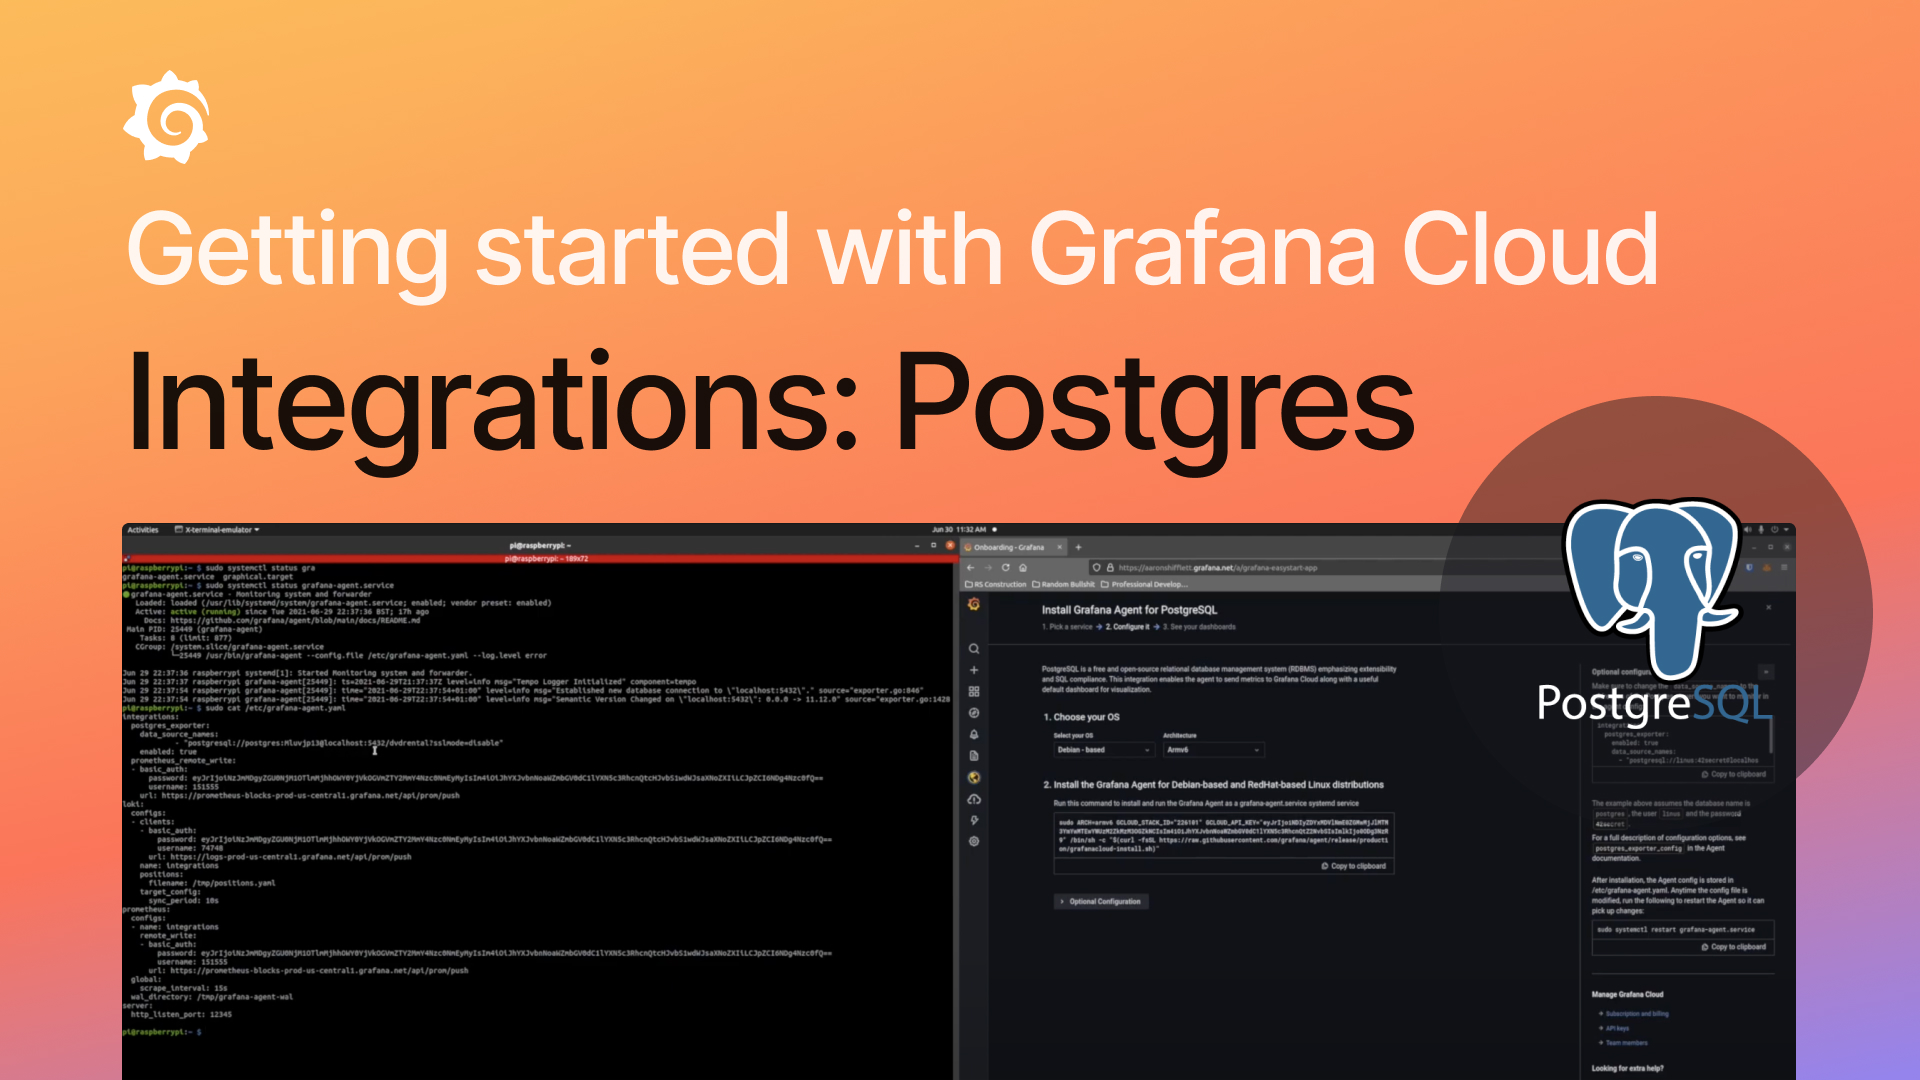
Learn how to quickly monitor a PostgreSQL database using the Grafana Cloud. If you haven’t yet, sign up for a free Grafana Cloud account, which includes 10,000 series for Prometheus or Graphite metrics, 50GB of logs, 50GB of traces, 500VUh of k6 testing, and much more.
Webinar
Getting Started with Grafana Cloud: Postgres Integration
Jul 20, 2021
Happening now!
17:00 PT, 20:00 ET, 00:00 UTC
On-demand
This webinar has concluded
Sorry, an error occurred. For help, email us at update@grafana.com

Resources
Get started quickly with the Grafana Cloud free tier
- 10k metrics
- 50GB logs
- 50GB traces
- 50GB profiles
- And more
More great videos and webinars

Webinar
•
18 Jun
Intro to Application and Frontend Observability with Grafana Cloud
In this webinar, we will introduce you to two of our latest opinionated solutions in Grafana Cloud that resolve issues faster with unified...

Webinar
•
11 Jun
Getting started with managing your metrics, logs, and traces using Grafana
In this webinar, we’ll demo how to get started using the LGTM Stack: Loki for logs, Grafana for visualization, Tempo for traces, and Mimir for...

Webinar
•
04 Jun
Intro to Kubernetes monitoring in Grafana Cloud
In this webinar you’ll learn how Grafana offers developers and SREs a simple and quick-to-value solution for monitoring their Kubernetes...