What you'll learn
- Track real-time usage and cost drivers
- Optimize costs with Adaptive Metrics and Logs
- Forecast usage and set intelligent alerts
- Build a cost management dashboard step by step
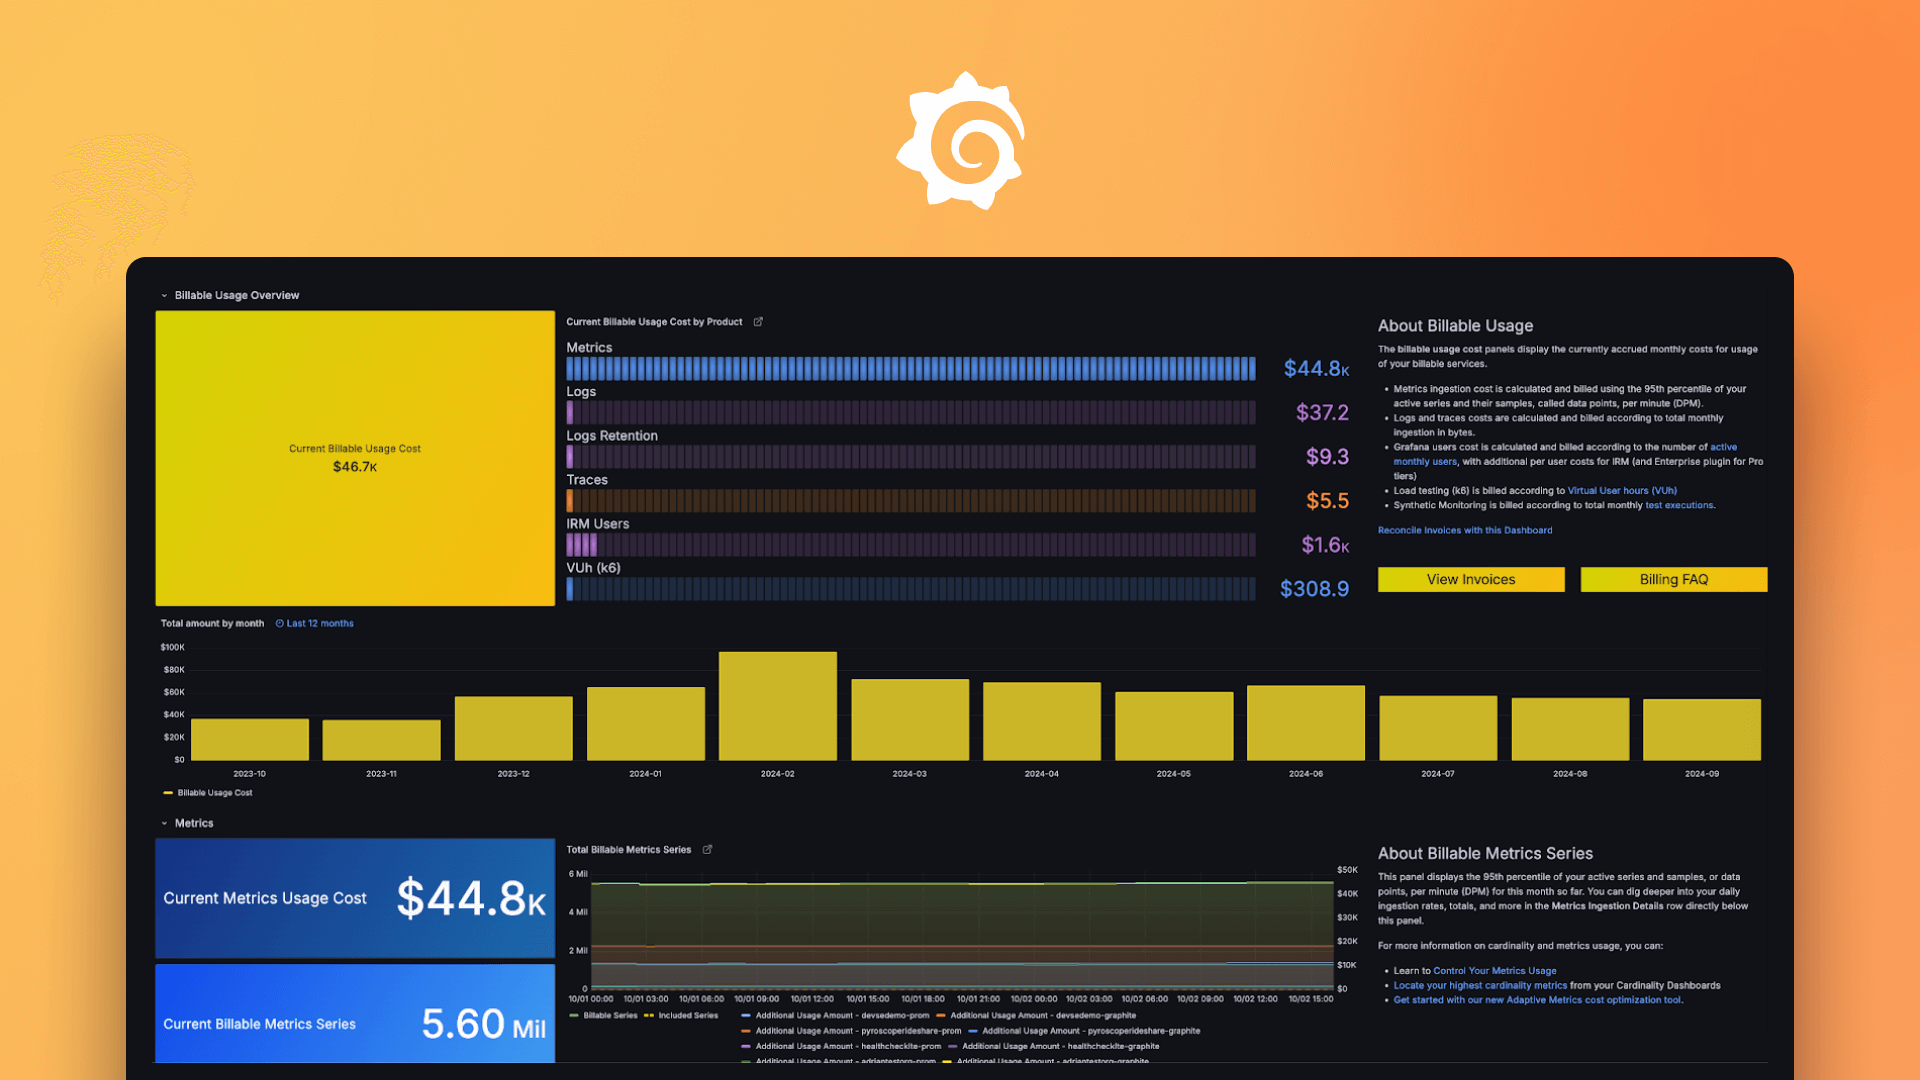
Track, forecast, and reduce observability usage in Grafana Cloud
Unexpected usage spikes. Time-consuming manual metric audits. Unclear cost drivers. If any of these sound familiar, you’re not alone. In this hands-on session, you’ll learn how to move from reactive cost management to proactive optimization—using built-in tools in Grafana Cloud.
We’ll walk through how to monitor usage in real time, set up forecasting and alerts, and reduce costs using Adaptive Metrics and Adaptive Logs.
Your guides

Wei-Chin Call
Senior Solutions Engineer
Grafana Labs

Naima Alexander
Associate Solutions Engineer
Grafana Labs