Favor Delivery, a Texas grocery and food delivery service under the HEB umbrella, runs about 100 services across 12 engineering squads with a four-person SRE team. After moving to Kubernetes and a microservice architecture, it replaced noisy, unactionable alerts with a service-level-objective practice built in Grafana Cloud — and gave every squad a single dashboard that catches problems before customers do.
Challenge
Favor’s monitoring problems arrived alongside its growth. The company had recently moved its services onto Kubernetes and adopted microservices, and its engineering department had expanded quickly from a few concentrated teams to more than a dozen squads, including a brand-new SRE team. The visibility didn’t keep pace. Alerts were noisy and unactionable — they paged people who didn’t know what to do with them.
The deeper issue was that engineers lacked a shared picture of how their services were actually behaving. When Kevin Panahi, Favor’s senior site reliability engineer, interviewed for the role, he asked a senior software engineer why the company wanted an SRE function. “I kind of just don’t know what’s going on,” the engineer admitted. With around 100 services and only four SREs, an embedded model was off the table, so Favor needed a way for a small team to raise reliability standards across every squad at once.
Solution
Favor started with the signals it already had. A service mesh running in its Kubernetes cluster emits request and response codes and application latency for each service; Grafana Alloy collects those metrics and ships them to Grafana Cloud, where recording rules and alerts run. From there the team defined service level indicators for availability and latency, set tiered objectives that each squad chooses for its own services, and layered error budgets and burn-rate alerts on top.
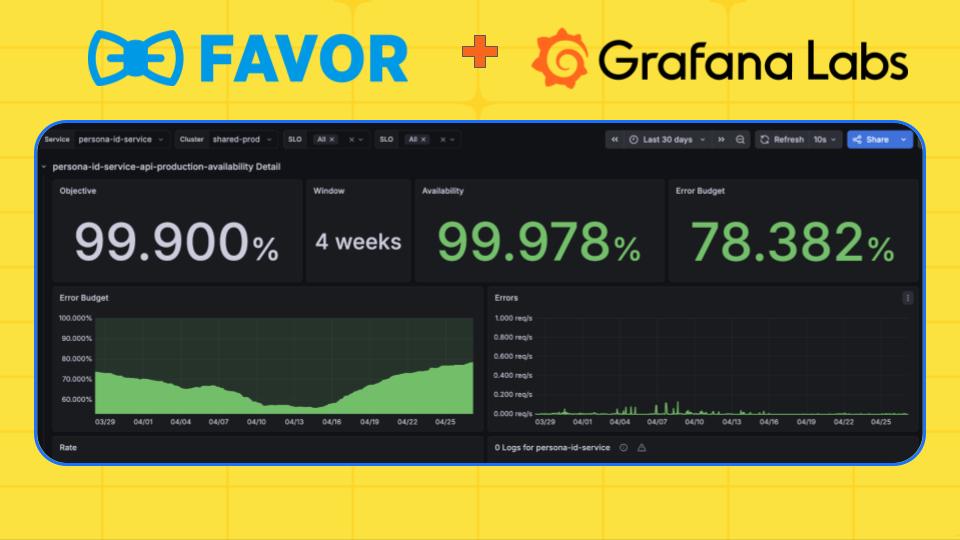
To make the practice stick, Favor built the Operational Readiness Review — a single Grafana dashboard that serves as a live report card for each squad. It pulls Prometheus and Alertmanager data alongside third-party sources through the Infinity data source, and the on-call SRE walks each team through it every two weeks: incident follow-ups, active and missing SLOs, services burning their error budgets, and a frank review of which alerts are actually helping. Each session works as a mini postmortem, spreading hard-won context across the whole squad rather than leaving it with the one or two people who fixed the problem.
Impact
Favor shifted from reactive firefighting to proactive, squad-owned reliability.
- Alert volume rose 7% while deployed services grew 25%, sharply reducing alerts per service
- Incident detection flipped from 2/3 found externally to 2/3 caught internally, before customers notice
- Critical incidents — those with quantifiable financial impact — decreased at a similar overall incident volume
- Questions to the “Ask SRE” Slack channel dropped 30%, reducing interrupts for the on-call SRE
- A four-person SRE team now reaches all ~100 engineers through a biweekly ceremony, without an embedded model
- The Operational Readiness Review still draws full squad attendance more than a year after launch
- Per-endpoint, per-method SLOs let teams catch a slow fast-path without slow calls masking it
“Now if there’s an incident that’s happening, there’s a 2/3 chance that we found it before a customer or some other third party did. It’s both a place where our engineers can go and get that initial report card, but also just kind of keeping that intimate feel of a small engineering institution even as it’s growing.”
— Kevin Panahi, Senior Site Reliability Engineer, Favor Delivery
Looking ahead
The review keeps generating new work from engineer feedback. Favor has added frontend observability with Grafana Faro, private load zones for Grafana Cloud k6, SLOs for Kafka consumer groups, and more advanced alert routing that defers non-urgent overnight pages. As the engineering org keeps growing, the single pane of glass remains how Favor gets every team speaking the same language about reliability.
Your guide