Important: This documentation is about an older version. It's relevant only to the release noted, many of the features and functions have been updated or replaced. Please view the current version.
Generate metrics from spans
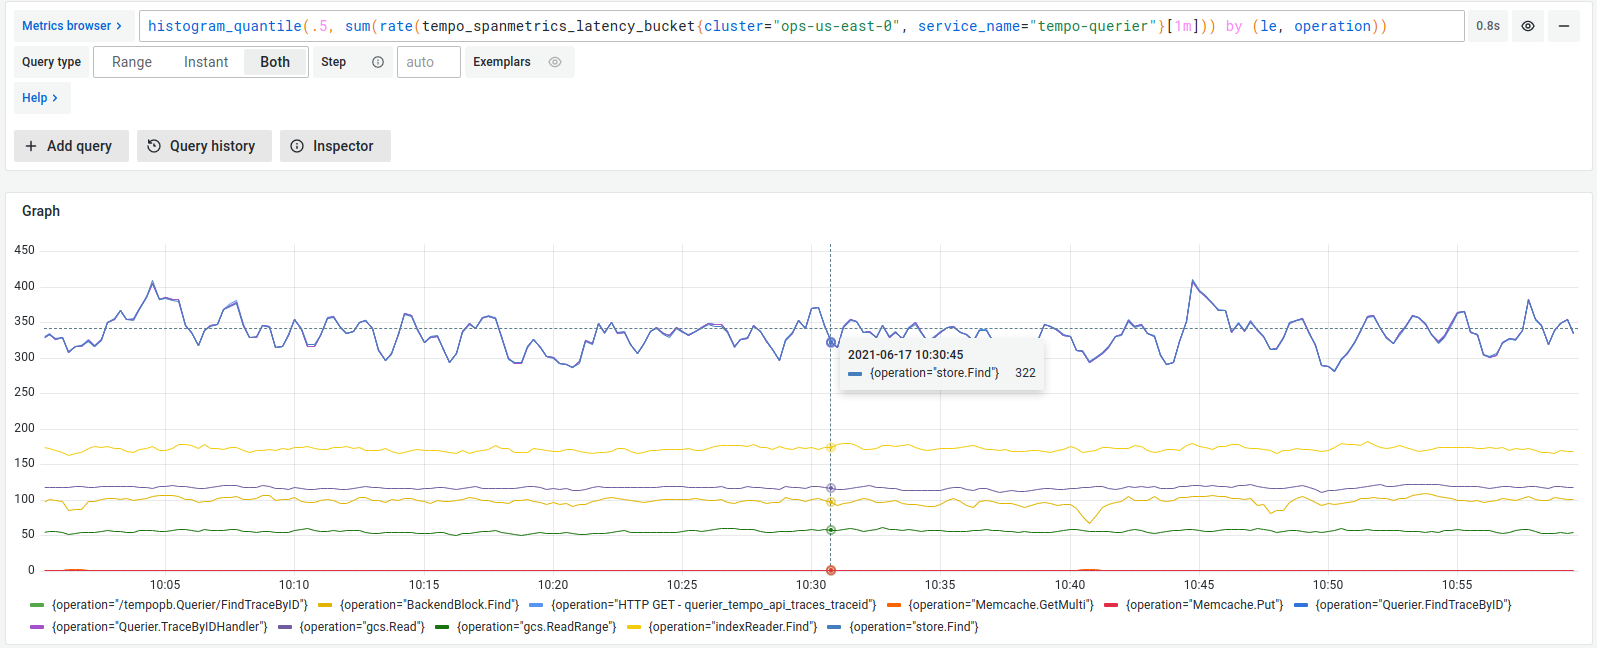
The span metrics processor generates metrics from ingested tracing data, including request, error, and duration (RED) metrics.
Span metrics generate two metrics:
- A counter that computes requests
- A histogram that tracks the distribution of durations of all requests
Span metrics are of particular interest if your system is not monitored with metrics, but it has distributed tracing implemented. You get out-of-the-box metrics from your tracing pipeline.
Even if you already have metrics, span metrics can provide in-depth monitoring of your system. The generated metrics will show application level insight into your monitoring, as far as tracing gets propagated through your applications.
Last but not least, span metrics lower the entry barrier for using exemplars. An exemplar is a specific trace representative of measurement taken in a given time interval. Since traces and metrics co-exist in the metrics-generator, exemplars can be automatically added, providing additional value to these metrics.
How to run
To enable service graphs in Tempo/GET, enable the metrics generator and add an overrides section which enables the span-metrics generator. See here for configuration details.
How it works
The span metrics processor works by inspecting every received span and computing the total count and the duration of spans for every unique combination of dimensions. Dimensions can be the service name, the operation, the span kind, the status code and any attribute present in the span.
This processor is designed with the goal to mirror the implementation from the OpenTelemetry Collector of the processor with the same name.
Metrics
The following metrics are exported:
Note: In Tempo 1.4 and 1.4.1 the histogram metric was called
traces_spanmetrics_duration_seconds. This was changed later to be consistent with the metrics generated by the Grafana Agent and the OpenTelemetry Collector.
Example