Important: This documentation is about an older version. It's relevant only to the release noted, many of the features and functions have been updated or replaced. Please view the current version.
Service graphs
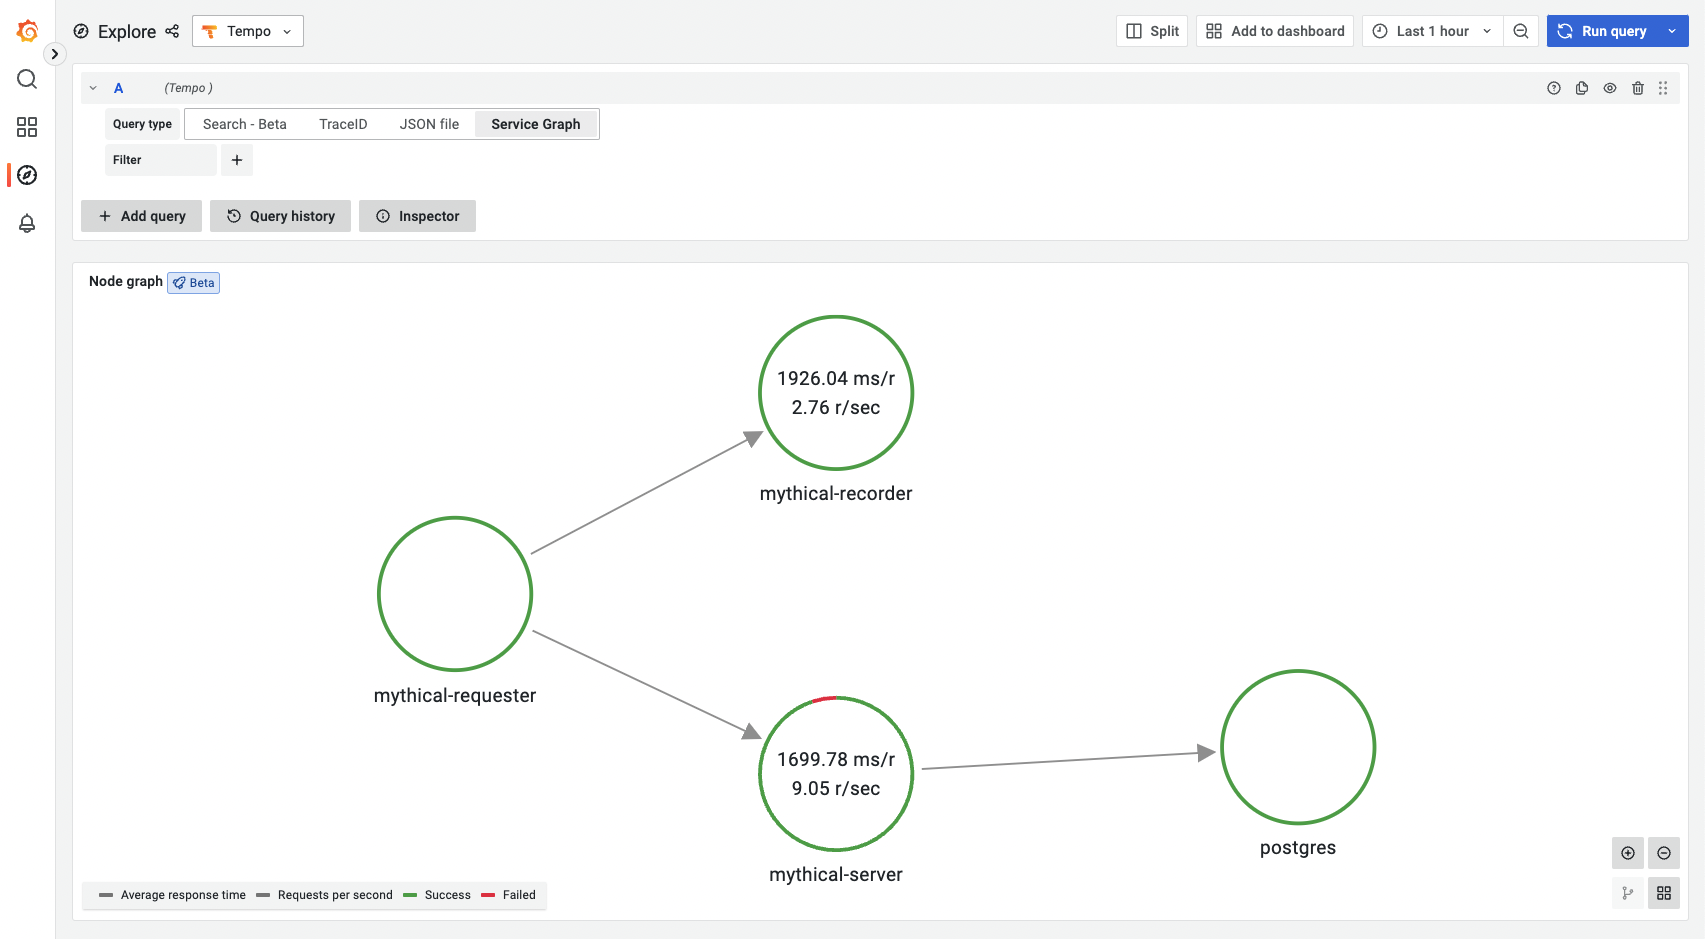
A service graph is a visual representation of the interrelationships between various services. Service graphs help you to understand the structure of a distributed system, and the connections and dependencies between its components:
- Infer the topology of a distributed system. As distributed systems grow, they become more complex. Service graphs help you to understand the structure of the system.
- Provide a high-level overview of the health of your system. Service graphs display error rates, latencies, as well as other relevant data.
- Provide an historic view of a system’s topology. Distributed systems change very frequently, and service graphs offer a way of seeing how these systems have evolved over time.
How they work
The metrics-generator processes traces and generates service graphs in the form of prometheus metrics.
Service graphs work by inspecting traces and looking for spans with parent-children relationship that represent a request. The processor uses the OpenTelemetry semantic conventions to detect a myriad of requests. It currently supports the following requests:
- A direct request between two services where the outgoing and the incoming span must have
span.kind,client, andserver`, respectively. - A request across a messaging system where the outgoing and the incoming span must have
span.kindproducerandconsumerrespectively. - A database request; in this case the processor looks for spans containing attributes
span.kind=clientas well asdb.name.
Every span that can be paired up to form a request is kept in an in-memory store, until its corresponding pair span is received or the maximum waiting time has passed. When either of these conditions are reached, the request is recorded and removed from the local store.
Each emitted metrics series have the client and server label corresponding with the service doing the request and the service receiving the request.
tempo_service_graph_request_total{client="app", server="db", connection_type="database"} 20Metrics
The following metrics are exported:
Duration is measured both from the client and the server sides.
Possible values for connection_type: unset, messaging_system, or database.
Additional labels can be included using the dimensions configuration option.
Since the service graph processor has to process both sides of an edge, it needs to process all spans of a trace to function properly. If spans of a trace are spread out over multiple instances, spans are not paired up reliably.
Cardinality
Cardinality can pose a problem when you have lots of services. There isn’t a direct formula or solution to this issue. But the following guide should help estimate the cardinality that the feature will generate.
How to estimate the cardinality
Cardinality from traces
The amount of edges depends on the number of nodes in the system and the direction of the requests between them. Let’s call this amount hops. Every hop will be a unique combination of client + server labels.
For example:
- A system with 3 nodes
(A, B, C)of which A only calls B and B only calls C will have 2 hops(A → B, B → C) - A system with 3 nodes
(A, B, C)that call each other (i.e. all bidirectional links somehow) will have 6 hops(A → B, B → A, B → C, C → B, A → C, C → A)
We can’t calculate the amount of hops automatically based upon the nodes,
but it should be a value between #services - 1 and #services!.
If we know the amount of hops in a system, we can calculate the cardinality of the generated service graphs:
  traces_service_graph_request_total: #hops
  traces_service_graph_request_failed_total: #hops
  traces_service_graph_request_server_seconds: 3 buckets * #hops
  traces_service_graph_request_client_seconds: 3 buckets * #hops
  traces_service_graph_unpaired_spans_total: #services (absolute worst case)
  traces_service_graph_dropped_spans_total: #services (absolute worst case)
Finally, we get the following cardinality estimation:
Sum: 8 * #hops + 2 * #servicesDry-running the metrics-generator
An often most reliable solution is by running the metrics-generator in a dry-run mode.
That is generating metrics but not collecting them, thus not writing them to a metrics storage.
The override metrics_generator_disable_collection is defined for this use-case.
To get an estimate, run the metrics-generator normally and set the override to false.
Then, check tempo_metrics_generator_registry_active_series to get an estimation of the active series for that set-up.
How to run
Service graphs are generated in Tempo and pushed to a metrics storage. Then, they can be represented in Grafana as a graph. You will need those components to fully use service graphs.
Tempo
To enable service graphs in Tempo/GET, enable the metrics generator and add an overrides section which enables the service-graphs generator. See here for configuration details.
Grafana
Note Since 9.0.4 service graphs have been enabled by default in Grafana. Prior to Grafana 9.0.4, service graphs were hidden
under the feature toggle tempoServiceGraph.
Configure a Tempo data source’s ‘Service Graphs’ by linking to the Prometheus backend where metrics are being sent:
apiVersion: 1
datasources:
  # Prometheus backend where metrics are sent
  - name: Prometheus
    type: prometheus
    uid: prometheus
    url: <prometheus-url>
    jsonData:
        httpMethod: GET
    version: 1
  - name: Tempo
    type: tempo
    uid: tempo
    url: <tempo-url>
    jsonData:
      httpMethod: GET
      serviceMap:
        datasourceUid: 'prometheus'
    version: 1
