This is documentation for the next version of Grafana Tempo documentation. For the latest stable release, go to the latest version.
Validate your local Tempo deployment
After you’ve set up Grafana Tempo, the next step is to verify that traces are ingested, stored, and queryable.
This page covers two levels of validation:
- Quick validation uses
telemetrygenand the Tempo HTTP API to confirm traces flow end-to-end from the command line, with no additional services required. - Grafana validation connects Grafana to your local Tempo instance so you can explore traces visually.
Before you begin
To follow this procedure, you need:
- A locally installed and running Tempo service (refer to Deploy on Linux)
- OpenTelemetry
telemetrygeninstalled for generating test traces - A running Grafana instance (refer to the installation instructions), only required for the Grafana validation section
Verify Tempo is running
Check the service status:
systemctl is-active tempoYou should see the status
activereturned. If you don’t, check that the configuration file is correct, and then restart the service. You can also usejournalctl -u tempoto view the logs for Tempo to determine if there are any obvious reasons for failure to start.Verify that Tempo created the storage subdirectories:
ls /data/tempo/You should see
walandblocksdirectories.If you configured Tempo with an S3-compatible backend instead of local storage, refer to Verify data in your S3-compatible store for storage verification steps.
Send test traces
Use OpenTelemetry telemetrygen to send traces to Tempo. The following command sends 100 traces (20 per second for 5 seconds) over OTLP gRPC:
telemetrygen traces --otlp-insecure --rate 20 --duration 5s --otlp-endpoint localhost:4317Verify traces using the Tempo API
After sending traces, you can verify them directly using the Tempo HTTP API. No additional services are required.
Search for recent traces:
curl -s http://localhost:3200/api/search | jq .You should see a
tracesarray containing your test traces. Each entry includes atraceID,rootServiceName, androotTraceName. For example:{ "traces": [ { "traceID": "abc123...", "rootServiceName": "telemetrygen", "rootTraceName": "lets-go", "startTimeUnixNano": "1776912138880042305" } ] }Note
Trace data appears in search results after the live store flushes completed blocks to disk, which can take 15–30 seconds. If the
tracesarray is empty, wait and retry.Retrieve a specific trace by ID using a
traceIDvalue from the search results:curl -s http://localhost:3200/api/v2/traces/<TRACE_ID> | jq .Replace
<TRACE_ID>with an actual trace ID from the previous step.
If both commands return trace data, your Tempo installation is ingesting, storing, and serving traces correctly.
Refer to the
Tempo HTTP API documentation for the full API reference and
Push spans for alternative approaches using curl (HTTP) or telemetrygen (gRPC) to send traces.
Verify traces in Grafana
If you have a Grafana instance running, you can verify that traces are visible in the Grafana Explore view. If Grafana is not already installed, refer to the installation instructions. For the full Tempo data source configuration reference, refer to Configure the Tempo data source.
In Grafana, navigate to Connections > Data sources and select Add data source.
Select Tempo and set the URL to
http://localhost:3200.Select Save & Test. You should see a message that says
Data source is working.Navigate to the Explore page, select the Tempo data source, and choose the Search query type.
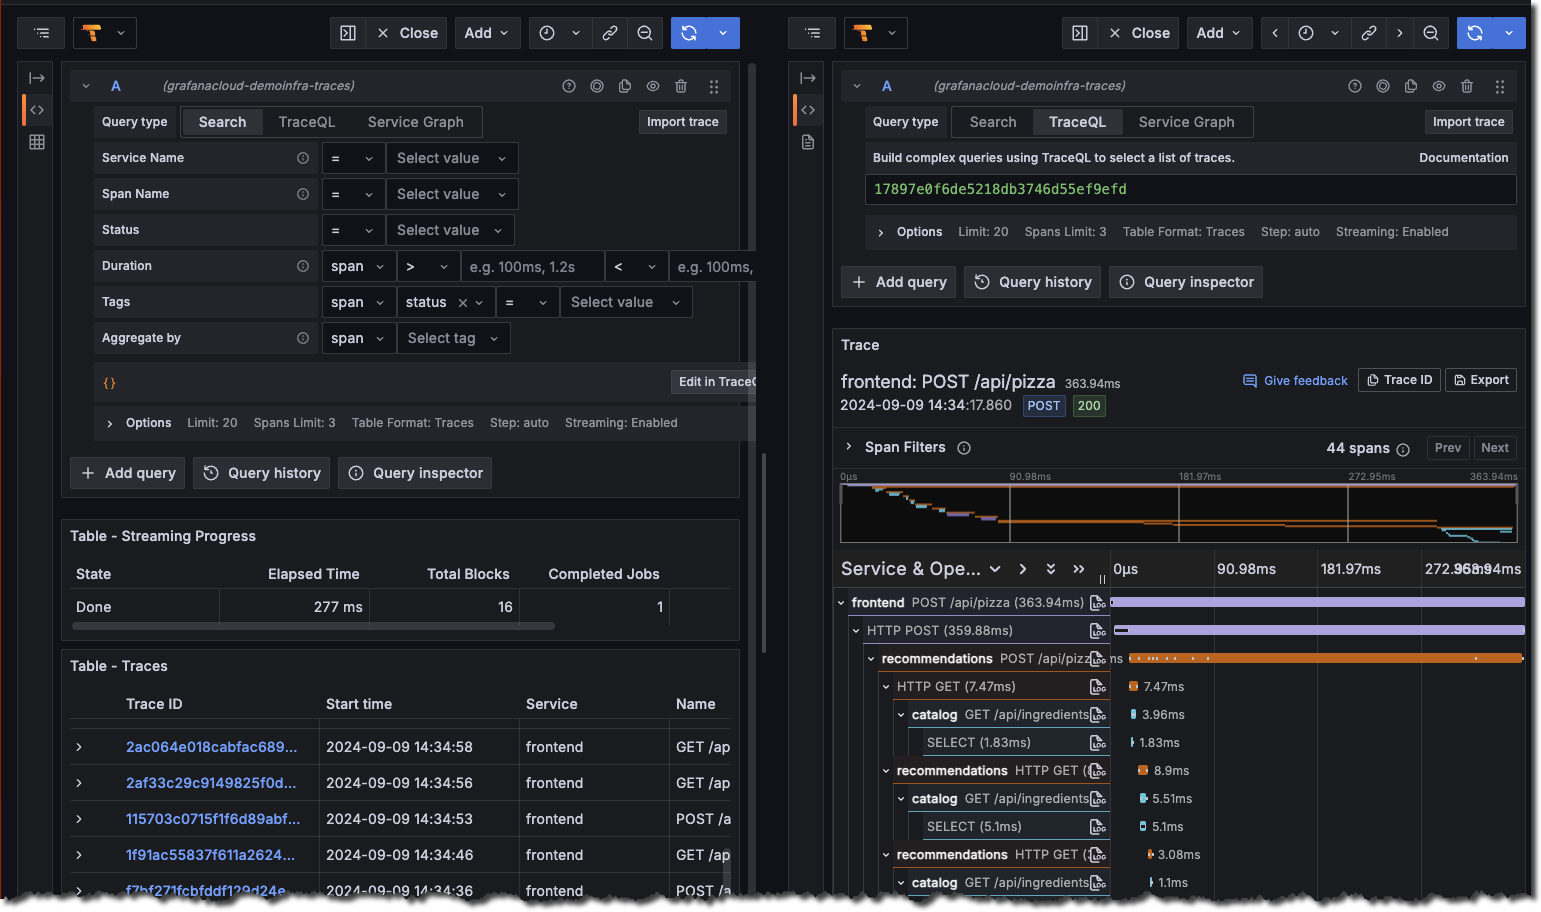
Select Run query to list the recent traces stored in Tempo. You should see traces from
telemetrygenin the results. Select a trace to view its spans:![Use the query builder to explore tracing data in Grafana]()
Optional: Metrics-generator
If you are using the metrics-generator, you can enable it to generate metrics from the traces.
Edit the configuration at
/etc/tempo/config.ymland add or update themetrics_generatorsection. Set theremote_writeURL to the address of your Prometheus-compatible storage instance. The configuration section should look like this:metrics_generator: storage: path: /tmp/tempo/generator/wal remote_write: - url: http://localhost:9090/api/v1/write send_exemplars: trueSave the file and exit the editor.
Restart the Tempo service:
sudo systemctl restart tempoAfter a couple of minutes, select the Service graph tab for the Tempo data source in the Explore page. Select Run query to view a service graph, generated by the Tempo metrics-generator.
![Service graph sample]()

Next steps
After you validate your local Tempo deployment, consider exploring these topics:
- Instrument for distributed tracing to send traces from your own applications instead of a test generator
- Configure Tempo to customize settings for your environment
- Set up monitoring for Tempo to observe your Tempo instance with dashboards and alerts
- Use tracing data in Grafana to learn more about querying and visualizing traces

