This is documentation for the next version of Grafana Tempo documentation. For the latest stable release, go to the latest version.
Version 3.0 release notes
The Tempo team is pleased to announce the release of Grafana Tempo 3.0.
This release gives you:
- New architecture: Splits the write and read path, offering increased reliability and scalability, lower TCO and moving TraceQL metrics to general availability.
- TraceQL metrics generally available: Production-ready trace-derived metrics at runtime with new comparison operators. Alerting on TraceQL metrics is an experimental capability.
- Metrics-generator improvements: Per-label cardinality limiting, service graph filtering, and span multiplier support for sampled environments.
- Trace redaction: New CLI command and API for hiding sensitive trace data.
- Span profiling: Native Pyroscope integration links profiling data to trace spans.
- Query performance improvements: Doubled the number of dedicated columns and optimized TraceQL AST.
To learn more about this release, refer to the Tempo 3.0 blog post.
These release notes highlight the most important features and bug fixes. For a complete list, refer to the Tempo CHANGELOG.
New architecture
Tempo 3.0 introduces a new architecture that replaces ingesters with a design that separates read and write paths. In microservices mode, a Kafka-compatible system provides durable buffering between ingestion and downstream components. In monolithic mode, Tempo runs all components in-process without Kafka.
Previously known as “Project Rhythm” (experimental in 2.9 and 2.10), this architecture is now the default and only ingest path.
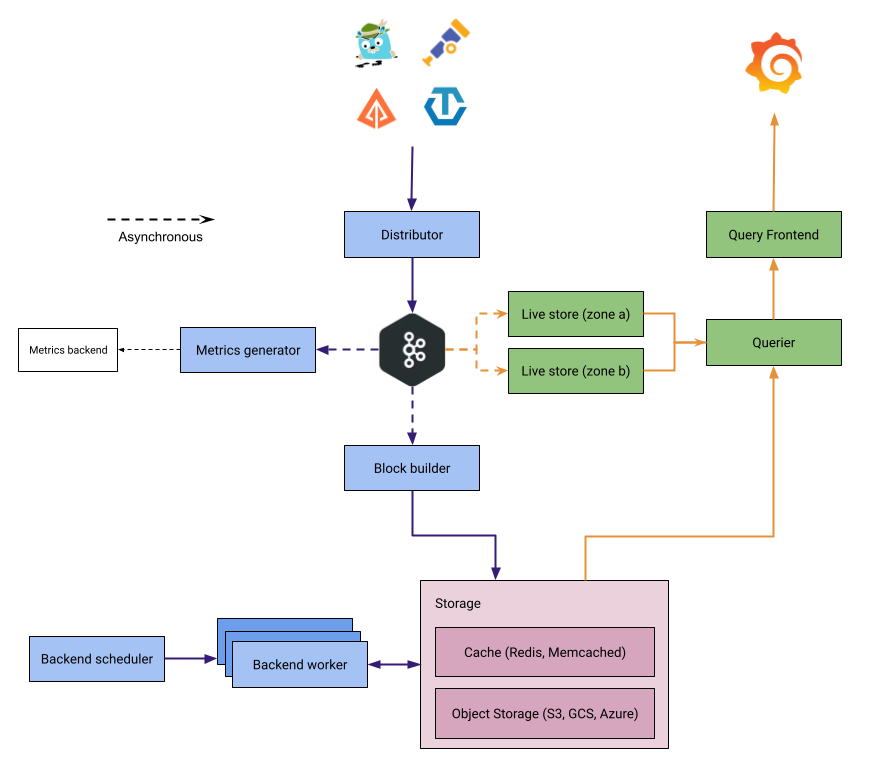
For an overview of the components and data flow, refer to Tempo architecture.
Greater resilience
In microservices mode, Kafka durably buffers trace data between ingestion and storage. Writes are acknowledged only after Kafka confirms receipt, ensuring durable ingestion even when downstream components are restarting or under load.
The read and write paths are fully decoupled and isolated from each other. Failures or load spikes on one path don’t affect the other.
Live-stores serve recent data from multiple availability zones, providing high availability without deduplication overhead.
Lower total cost of ownership
The new architecture reduces costs in three ways.
First, it eliminates duplicated responsibilities where ingesters and the metrics-generator both created and flushed blocks.
Second, it reduces data in object storage. The previous architecture required replication factor 3 (RF3), which produced 2 to 2.5 times data duplication. The new design operates at RF1 with no duplication. Traces are sharded by ID to unique Kafka partitions, so each block is built exactly once.
Third, better autoscaling support lowers resource waste during low-traffic periods.
Simpler operations
Each new component has a single, well-defined responsibility: block-builders create blocks, live-stores serve recent queries, and the backend scheduler and worker manage compaction and retention.
This clear separation makes the system easier to reason about and operate.
Compaction is now job-based, with centralized progress tracking, automatic rescheduling of failed jobs, and no duplicated work.
What changed
- Block-builders consume from Kafka and build blocks for object storage (microservices mode).
- Live-stores serve recent data queries.
- The backend scheduler and worker replace the compactor for compaction and retention.
For full component details, refer to the Tempo architecture pages.
Upgrade to 3.0
For migration steps, breaking changes, and upgrade considerations, refer to Migrate to 3.0.
You can also use the
tempo-cli migrate config command to migrate your configuration from 2.x to 3.0. [PR 6982]
TraceQL metrics
TraceQL metrics move to general availability in Tempo 3.0. You can now build dashboards directly from trace data using metrics queries, without relying on the metrics-generator to pre-compute them. Refer to TraceQL metrics queries to learn more.
Note
While TraceQL metrics are generally available, alerting on TraceQL metrics is an experimental feature. Engineering and on-call support is not available for the alerting use case.
Comparison operators in metrics queries
With the new comparison operators, you can filter metrics results to only the data points that cross a threshold. Comparison operators are the foundation for alerting on trace-derived metrics: write a query that returns a value only when something is wrong, and point an alert rule at it. [PR 6474]
For example, this query returns data only when a service exceeds 10 requests per second:
{} | rate() by (resource.service.name) > 10You can also filter on latency. This query finds endpoints where the average span duration exceeds one second:
{ span:name = "GET /:endpoint" } | avg_over_time(span:duration) > 1sAdditional TraceQL improvements
- The default
max_durationfor metrics queries increases to one day, so you can analyze longer time ranges without adjusting configuration. Default step intervals now align with vParquet5 timestamp columns for better query performance. [PR 6285, PR 6413] - An experimental faster read path is available for most metrics queries behind the query hint
spanonly_fetch=truewhenunsafe_query_hintsis enabled. A per-tenant override controls opt-in or opt-out. (PRs #6359, #6849) - Tag name and tag value autocomplete (
search tags v2) now supports
ORconditions. When you search for attribute values in Grafana or through the API, Tempo can match against multiple values in a single request, returning results faster. [PR 6827]
Metrics-generator
Tempo 2.10 introduced entity-based limiting for the metrics-generator. Tempo 3.0 builds on this with per-label cardinality control and new filter policies for both span metrics and service graphs.
Per-label cardinality limiting
The new per-label limiter prevents a single high-cardinality label from exhausting your entire series budget.
Set max_cardinality_per_label as a per-tenant override to cap how many distinct values any one label can have, while leaving other labels unaffected.
Accompanying demand-estimate metrics help you tune limits before they kick in. [PR 6414,
documentation]
Span name sanitization (experimental)
The span_name label often contributes the most to high cardinality in generated metrics.
Applications that embed dynamic values in span names, for example, REST paths with user IDs (GET /users/123) or auto-generated operation names (query-abc-def-ghi), create a unique series for every distinct value.
This drives up active series counts, increases storage and query costs, and can push you past cardinality limits.
You can enable span_name_sanitization to solve this without changing instrumentation across your services.
The option uses the DRAIN algorithm to learn patterns from incoming span names and replace variable segments with a <_> placeholder, reducing many unique span names down to a single representative series.
Use span name sanitization when:
- Your
span_namelabel has high cardinality due to embedded IDs, timestamps, or request parameters. - You don’t control the instrumentation that produces these span names, or changing it across all services isn’t practical.
- You want to reclaim active series budget without losing meaningful aggregation in your span metrics.
To use the capability, set the span_name_sanitization option in the overrides block of your Tempo configuration:
overrides:
  defaults:
    metrics_generator:
      span_name_sanitization: "enabled"
Refer to Reduce cardinality with span name sanitization for details. [PR 6098]
Span metrics filter improvements
The span metrics filter picks up an include_any policy, making it easier to capture specific spans, such as internal traffic from a single service, without opening up your filter to all internal spans. [PR 6392,
documentation]
Span multiplier
If you use head-based sampling, your metrics don’t reflect actual traffic volume. You can now set a span_multiplier_key per tenant to tell Tempo which span attribute holds the sampling ratio, so metric counts scale up to reflect your real request volume. [PR 6260,
documentation]
Service graph filter improvements
Service graphs now support the same filter_policies that span metrics already had. This means you can exclude noisy internal traffic or health checks from your service graph, keeping it clean and focused on the service-to-service communication you actually care about. [PR 6453,
documentation]
Additional metrics-generator improvements
- Support extracting span multiplier from W3C
tracestateOpenTelemetry probability sampling threshold via theenable_tracestate_span_multiplierconfiguration option. [PR 6684] - Allow duplicate dimensions for span metrics and service graphs, supporting environments with different instrumentation libraries that use different attribute naming conventions. [PR 6288]
- Allow
span_name_sanitizationto be set via the user-configurable overrides API. [PR 6411] - Deep validation for filter policies in the user-configurable overrides API. [PR 6407]
Trace redaction
Remove traces containing personally identifiable information or other sensitive data from object storage without waiting for retention to expire.
The
tempo-cli redact command submits redaction jobs to the
backend scheduler, which rewrites the affected blocks in object storage. You can monitor job progress through the
/status/backendscheduler endpoint. [PR 6832]
When individual span redaction isn’t enough, the TraceRedactor interface now supports hiding complete traces from query results through ErrTraceHidden.
You can use this to enforce data governance policies that keep specific traces out of query results entirely. Refer to
Compaction for details on how redaction jobs are scheduled and executed. [PR 6811]
Span profiling
Tempo 3.0 adds span profiling through otelpyroscope, so you can jump from a slow span in a trace directly to the CPU or memory profile that shows what that span was doing.
Instead of correlating traces and profiles manually, you get a direct link between the two in Grafana Pyroscope, making it faster to find the root cause of latency or resource issues at the code level. [PR 7063]
Under the hood, Tempo attaches pprof goroutine labels (span_id, span_name) to OpenTelemetry spans and adds a pyroscope.profile.id attribute to root spans.
Enable span profiling in your configuration file or with the CLI flag:
span_profiling: trueSpan profiling requires an OTLP exporter. Set OTEL_TRACES_EXPORTER, OTEL_EXPORTER_OTLP_ENDPOINT, or OTEL_EXPORTER_OTLP_TRACES_ENDPOINT in your environment. Refer to
command-line flags for details.
Query performance improvements
Tempo 3.0 speeds up queries through storage and query engine improvements. vParquet5 is now production-ready with expanded dedicated column support, and the TraceQL engine rewrites queries more efficiently.
vParquet5
vParquet5 is now production-ready. vParquet4 remains the default block format in this release. vParquet5 includes all the capabilities introduced as opt-in in 2.10, including event-scoped columns, blob detection, and array-valued dedicated columns, plus expanded dedicated column support.
New in 3.0, the maximum number of dedicated string columns doubles to 20 per scope, so you can move even more of your most-searched attributes into fast dedicated storage. The tempo-cli analyse blocks command now recommends the optimal number for your data. [PR 6282]
To enable vParquet5, set the block version in your storage configuration:
storage:
  trace:
    block:
      version: vParquet5
After you enable vParquet5, Tempo writes new blocks in vParquet5 format while continuing to read existing vParquet4 blocks. No migration of existing data is required.
For details, refer to Apache Parquet block format and Dedicated attribute columns.
TraceQL AST optimization
The TraceQL engine now automatically rewrites multiple conditions on the same attribute into a single array-aware check. This reduces the work the engine does per span and speeds up queries that filter on the same attribute more than once.
For example, this query evaluates more efficiently in 3.0 because the engine combines both conditions on span.http.status_code into one pass:
{ span.http.status_code >= 500 && span.http.status_code < 600 }This is a breaking change that alters how != and !~ behave on array attributes and introduces stricter validation of regular expression literals.
Refer to TraceQL array matching changes in the upgrade considerations for details on what to check before upgrading. [PR 6353]
Features and enhancements
The most important features and enhancements in Tempo 3.0 are highlighted below.
- Added
automemlimitsupport for automatic GOMEMLIMIT configuration. Enable withmemory.automemlimit_enabled: true. Refer to Configuration for details. [PR 6313] - Added KEDA-based horizontal Pod autoscaling support for microservices deployment in Jsonnet. [PR 6970]
- Enabled native histogram emission for all
promauto-registered histograms, includingtempo_request_duration_seconds. Both classic and native formats are emitted simultaneously; existing scrapers are unaffected. [PR 6910] - Added an extension mechanism for per-tenant overrides. Refer to User-configurable overrides for details. [PR 6758]
- Added support for per-tenant left-padding of trace IDs. Refer to
Configuration for the
left_pad_trace_idsparameter. [PR 6489] - Improved attribute truncating observability with per-scope metric labels and rate-limited diagnostic logging. Refer to Set max attribute size for details. (PRs #6400, #6467)
- Exposed MinIO retry settings via S3 configuration. Refer to
Configuration for the
retry_max_attempts,retry_backoff_initial, andretry_backoff_maxparameters. [PR 6561] - Block builder now deduplicates spans within traces during block creation. Removed duplicates are tracked via the
tempo_block_builder_spans_deduped_totalmetric. Refer to Block-builder for details. [PR 6539] - Added
--headerflag toquery apicommands for passing custom headers. Refer to the Tempo CLI documentation for usage details. [PR 6768]
Upgrade considerations
When upgrading to Tempo 3.0, be aware of these considerations and breaking changes.
Tempo 3.0 is a major release with significant architectural changes. Use the tempo-cli migrate config command to automate configuration migration. Refer to the
Migrate from Tempo 2.x to 3.0 guide for step-by-step instructions.
Ingester removal
The ingester module is removed entirely. All ingester-related configuration fields, CLI flags, alerts, and dashboard panels must be removed from your deployment. The write path is now exclusively handled by live-store and block-builder.
Removed configuration sections: ingester, ingester_client, compactor, metrics_generator_client.
The ingest.enabled field is also removed, but the ingest block itself is still required for microservices mode (for example, ingest.kafka).
(PRs #6959, #6504, #6667, #6873)
Compactor removal
The compactor component and the v2 block encoding are removed. Compaction is now handled by the
backend scheduler and worker, which track job progress centrally and automatically reschedule failed jobs.
Remove all compactor-related configuration, alerts, and dashboard panels from your deployment. The following CLI commands are also removed because they were specific to the v2 format: list block, list index, view index, gen index, and gen bloom.
The compaction CLI flags drop their duplicate compaction. prefix. Update these flags in your configuration:
compaction.compaction.block-retention→compaction.block-retentioncompaction.compaction.max-objects-per-block→compaction.max-objects-per-blockcompaction.compaction.max-block-bytes→compaction.max-block-bytescompaction.compaction.compaction-window→compaction.compaction-window
Target changes
The all target is now 3.0-compatible and the scalable-single-binary target is removed.
Refer to
Deployment modes for details. [PR 6283]
Block and WAL configuration centralization
block_builder and live_store now always use storage.trace.block settings. Per-module block configuration fields are removed. If you configured block or WAL settings separately for these modules, move them to storage.trace.block. [PR 6647]
Other removed components
- The OpenCensus receiver is removed. Migrate to OTLP. [PR 6523]
- The legacy
mem-ballast-size-mbsCLI flag is removed. UseGOMEMLIMITinstead. [PR 6403] SpanMetricsSummaryis removed and querier code simplified. (PRs #6496, #6510)
Configuration changes
- RetryInfo enabled by default:
distributor.retry_after_on_resource_exhaustednow defaults to5s(was0). OTLP clients receive a retry hint onResourceExhaustederrors. Set to0to disable cluster-wide, or set the per-tenant overrideingestion.retry_info_enabled: falseto disable for a single tenant. [PR 7088] - Read configuration consolidated:
query_frontend.search.query_ingesters_untilis removed in favor ofquery_frontend.search.query_backend_after. [PR 6507] - Legacy overrides disabled: Tempo refuses to start if legacy (flat, non-scoped) overrides are detected. Use
tempo-cli migrate overrides-configto convert them. Setenable_legacy_overrides: trueto opt back in temporarily. Refer to the Migrate from Tempo 2.x to 3.0 guide for details. [PR 6741] - Fail-on-high-lag enabled by default:
live_store.fail_on_high_lagnow defaults totrue(wasfalse). When a live-store’s Kafka lag overlaps a query’s time range, search and metrics requests return an error rather than silently incomplete results, trading availability for correctness. To restore the previous behavior, setlive_store.fail_on_high_lag: false. Accordingly,query_frontend.query_end_cutoffnow defaults to30s(was0), excluding the most recent 30 seconds from queries to avoid incomplete results; it must be less thanquery_frontend.search.query_backend_after. [PR 7210]
Stricter filter policy validation
Filter policies submitted through the user-configurable overrides API are now fully validated. Previously, invalid policies (for example, unsupported attribute scopes, malformed regular expressions, or unrecognized intrinsic values) were silently accepted. In Tempo 3.0, the API rejects them with a descriptive error.
If you have existing filter policies, verify they use only resource and span scopes, valid match_type values (strict or regex), and recognized intrinsic values for kind and status. Refer to
Filtering for the complete validation rules. [PR 6407]
TraceQL array matching changes
The TraceQL AST optimization changes the semantics of != and !~ operators when used with array attributes. != now means NOT IN (was CONTAINS NOT EQUAL) and !~ now means MATCH NONE (was CONTAINS NON-MATCH). Regex operands must be of type string or string array. Disable the optimization with the query hint skip_optimization=true if needed. [PR 6353]
Tempo CLI timestamp format
The query search command no longer accepts timestamps without timezone (for example, 2024-01-01T00:00:00). Use RFC3339 format (for example, 2024-01-01T00:00:00Z) or relative time (for example, now-1h). Refer to the
Tempo CLI documentation for details. [PR 6458]
Platform changes
The 32-bit ARM binary archives are no longer published. Release artifacts continue to include amd64 and arm64 binaries. If you run Tempo on 32-bit ARM hardware, you need to build from source or migrate to arm64. [PR 7106]
Go version upgrade
Tempo 3.0 upgrades to Go 1.26.2. [PR 6443]
Security fixes
3.0.2
- Built Tempo with Go 1.26.3, which includes upstream security and bug fixes. [PR 7423]
3.0.0
- Fixed division by zero error in TraceQL expressions that could cause query failures. [PR 6580]
- Fixed
intPowfunction hanging for certain inputs, which could cause unbounded CPU consumption. [PR 6581] - Fixed integer overflow in query parameters by using
strconv.ParseUintinstead ofstrconv.Atoi/strconv.ParseIntfor unsigned integer fields. [PR 6612] - Fixed allowlist header normalization when building the allowlist map. [PR 6481]
Bug fixes
For a complete list, refer to the Tempo CHANGELOG.
- Fixed panic in livestore search when iterating blocks encounters an unexpected error. [PR 7134]
- Fixed panic in old tag-style search when querying integer dedicated columns on vParquet5 blocks. [PR 7135]
- Fixed incorrect search results for some queries on blob columns. [PR 6815]
- Fixed active-series counter underflow in local series limiter when overflow series are deleted. [PR 6568]
- Fixed per-label limiter and sanitizer being incorrectly applied to
target_infoandhost_infometrics. [PR 6660] - Fixed
target_infobeing skipped when resource attributes have empty values. [PR 6774] - Fixed limiter leak and permanent overflow when old series are replaced. [PR 6653]
- Fixed dedicated column filtering issue. [PR 6586]
- Fixed buffer-reuse bug where event attributes in dedicated columns could be persisted on additional spans and events. [PR 6914]
- Fixed
span_name_sanitizationoverrides not reloading during runtime. [PR 6435] - Returned 400 instead of 500 when
query_rangeorquery_instantrequests have invalid start/end parameters. [PR 6694]

