Investigate trends and spikes
Grafana Profiles Drilldown provides powerful tools that help you identify and analyze problems in your applications and services.
Using these steps, you can use the profile data to investigate issues.
With Grafana Play, you can explore and see how it works, learning from practical examples to accelerate your development. This feature can be seen on the Grafana Play site.
Explore your profile data
When you use Profiles Drilldown, your investigations usually follow these steps.
Verify your data source in the Data source drop-down.
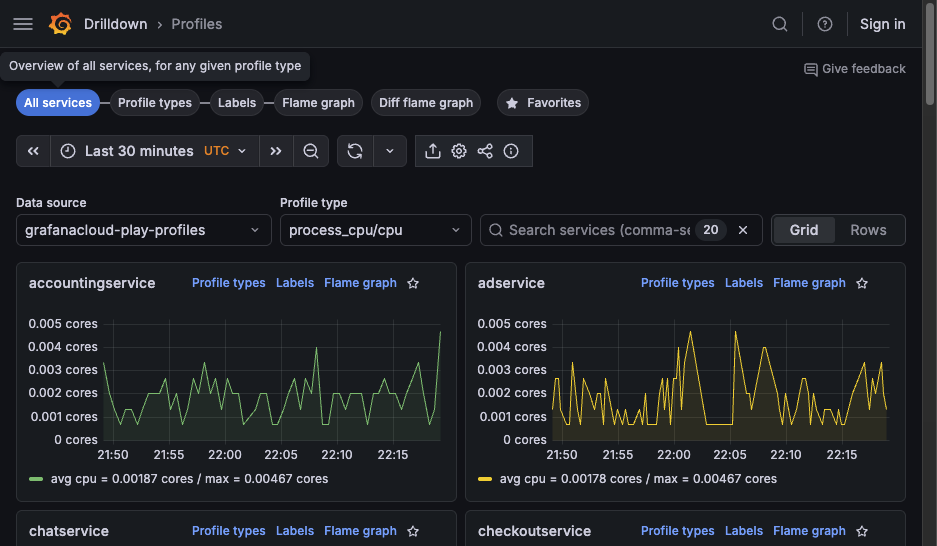
Choose an Exploration tab. All services is selected by default. Learn about the available views.
![The All services view]()
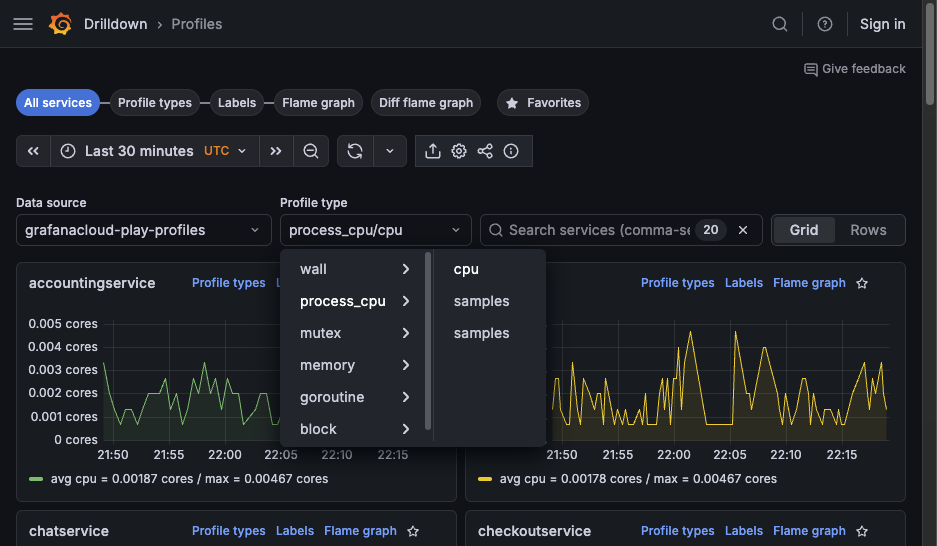
Look for spikes or trends in services to identify where to investigate. Use the Profile type drop-down to change profile metrics.
![Select a profile type]()
After you identify the service to explore, you can change views:
Select Profile types to review profile metrics for a service.
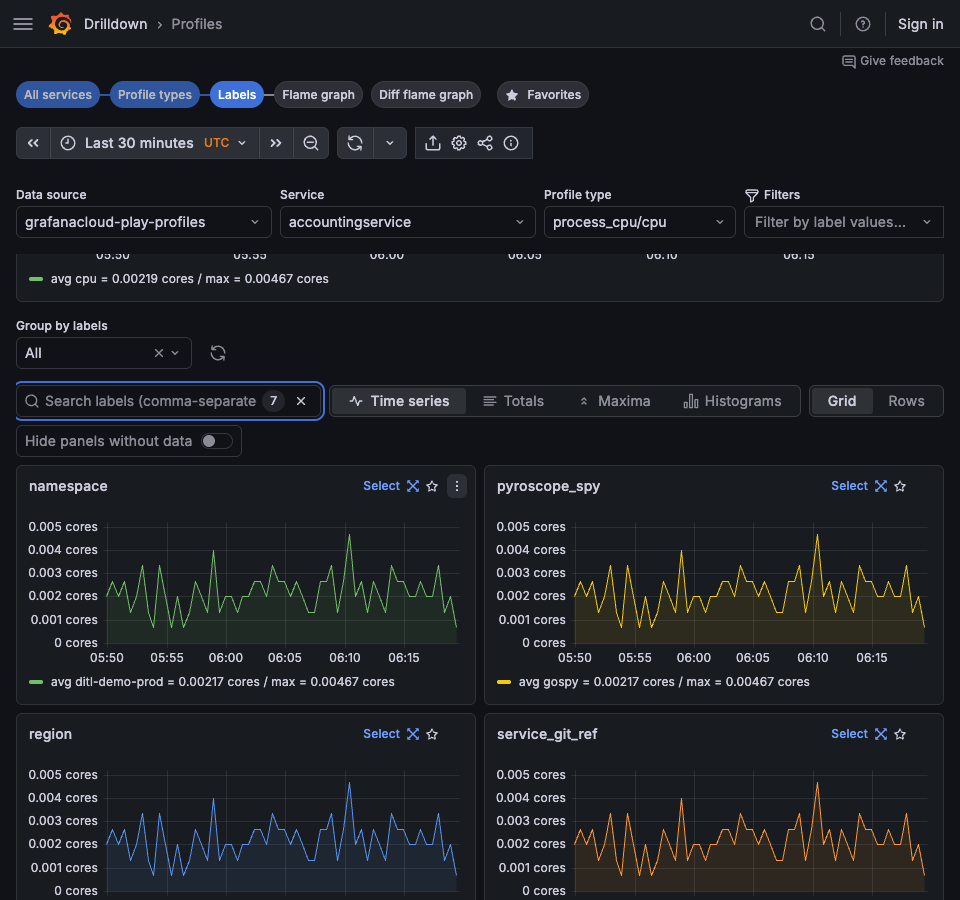
Select Labels to view labels for a service and refine the scope of your investigation.
Select Flame graph to view the flame graph for a service.
![Select an Exploration type to begin]()
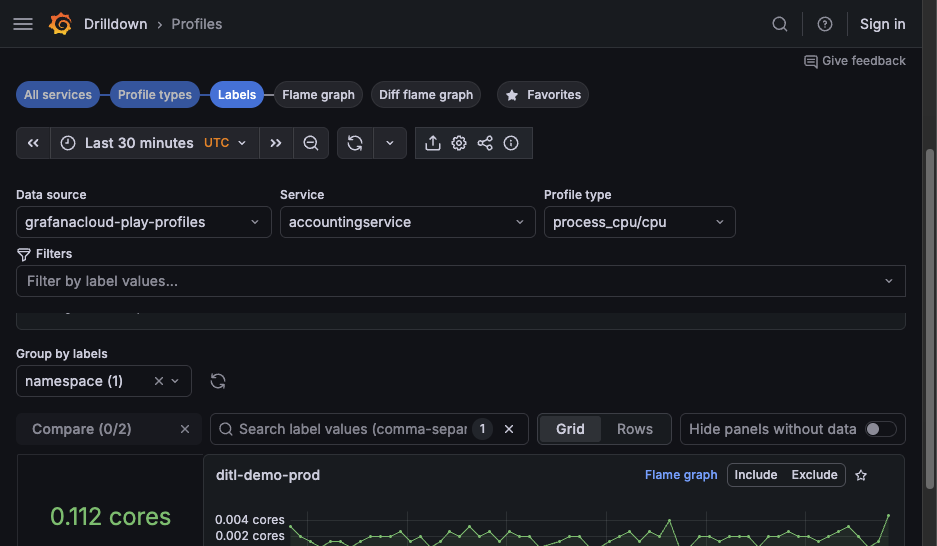
Optional: Select filters to focus on problem areas. Each filter is added to the filter expression near the top of the page. You can add filters in the following ways:
- Use filter selectors in the filter bar to add labels and operators.
- In Labels view, use Include or Exclude on areas of interest.
If Labels view shows no data, select a different service, profile type, or group-by label.
![Add filters]()
Optional: Click and drag on a chart to zoom to a smaller time range.
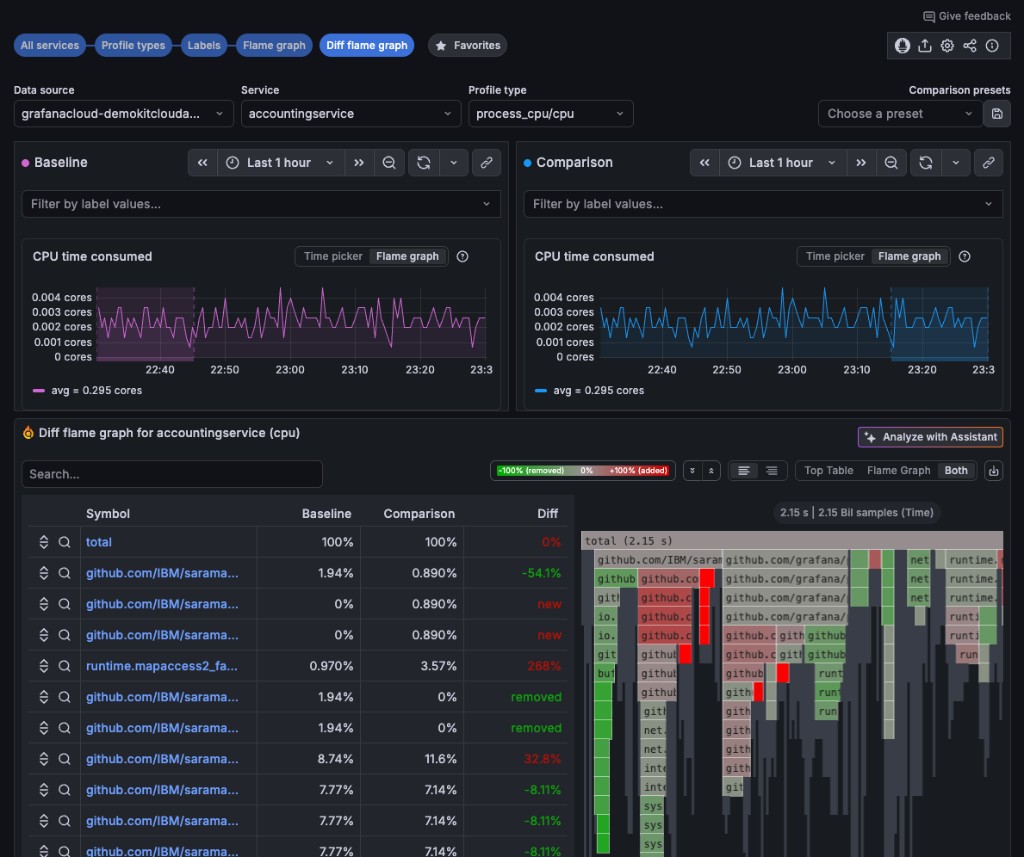
To compare two flame graphs, open Diff flame graph.
Configure Baseline and Comparison using time range selectors, label filters, and chart range selection.
Use Auto-select or choose a comparison preset to speed up setup.
![Labels view]()
Use Diff flame graph to compare where relative time share changes between baseline and comparison, and then drill into functions to identify likely causes.
![Viewing a flame graph during an investigation]()

Common tools during investigations
In the Profiles toolbar, you can also use these features while investigating:
- Upload ad hoc profiles to load profile data for one-off analysis.
- Copy shareable link to capture the current investigation state and share it with teammates.
- View/edit tenant settings to adjust settings such as collapsed flame graphs, function details, and maximum node count.


