Menu
Important: This documentation is about an older version. It's relevant only to the release noted, many of the features and functions have been updated or replaced. Please view the current version.
Documentation Grafana Mimir
Operator and user guide
Monitoring Mimir
Viewing dashboards
Rollout progress
Grafana Mimir
Operator and user guide
Monitoring Mimir
Viewing dashboards
Rollout progress
Open source
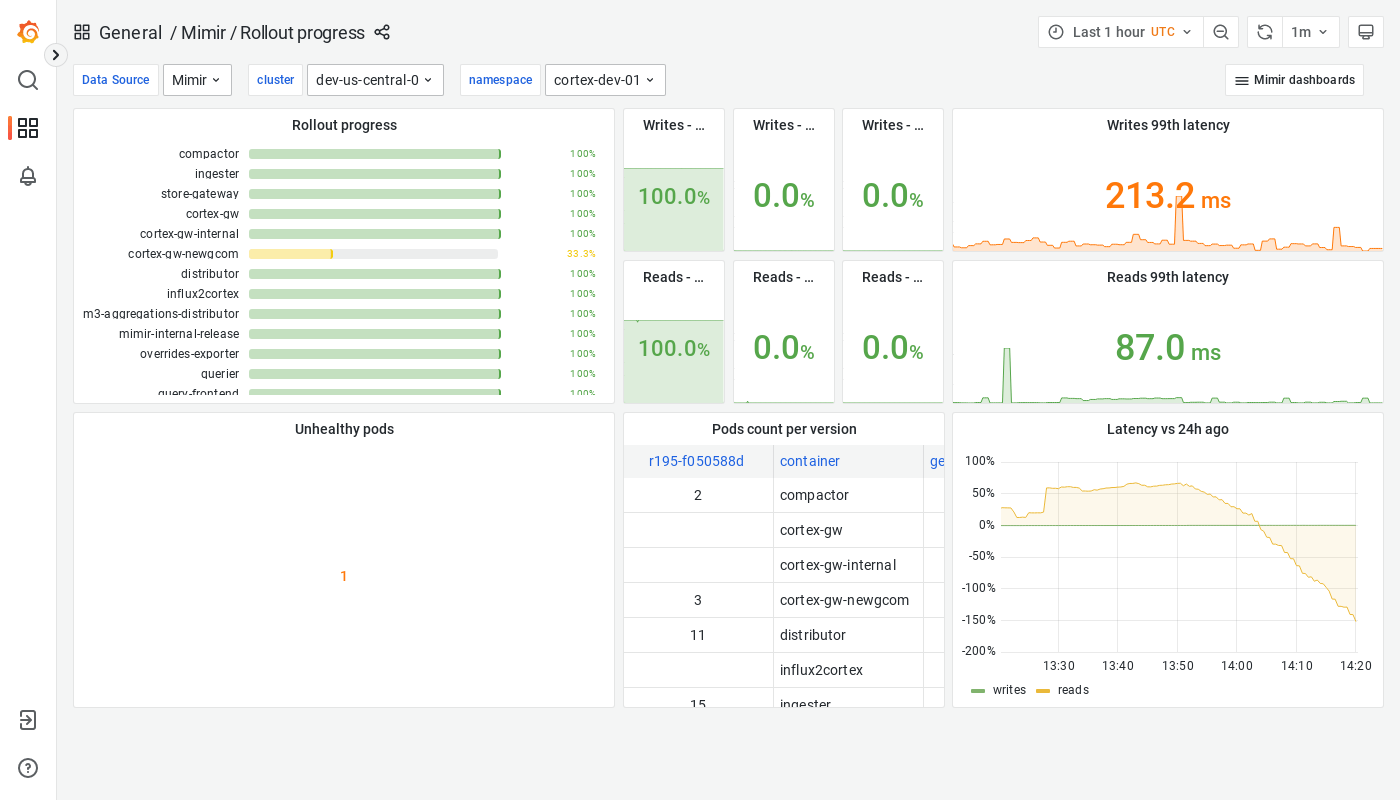
Grafana Mimir Rollout progress dashboard
The Rollout progress dashboard shows the progress of a rollout across a Grafana Mimir cluster and key metrics you can monitor, such as failure rates and latency.
Example
The following example shows a Rollout progress dashboard from a demo cluster.