Menu
Important: This documentation is about an older version. It's relevant only to the release noted, many of the features and functions have been updated or replaced. Please view the current version.
Documentation Grafana Mimir
Operator and user guide
Monitoring Grafana Mimir
Viewing dashboards
Queries
Grafana Mimir
Operator and user guide
Monitoring Grafana Mimir
Viewing dashboards
Queries
Open source
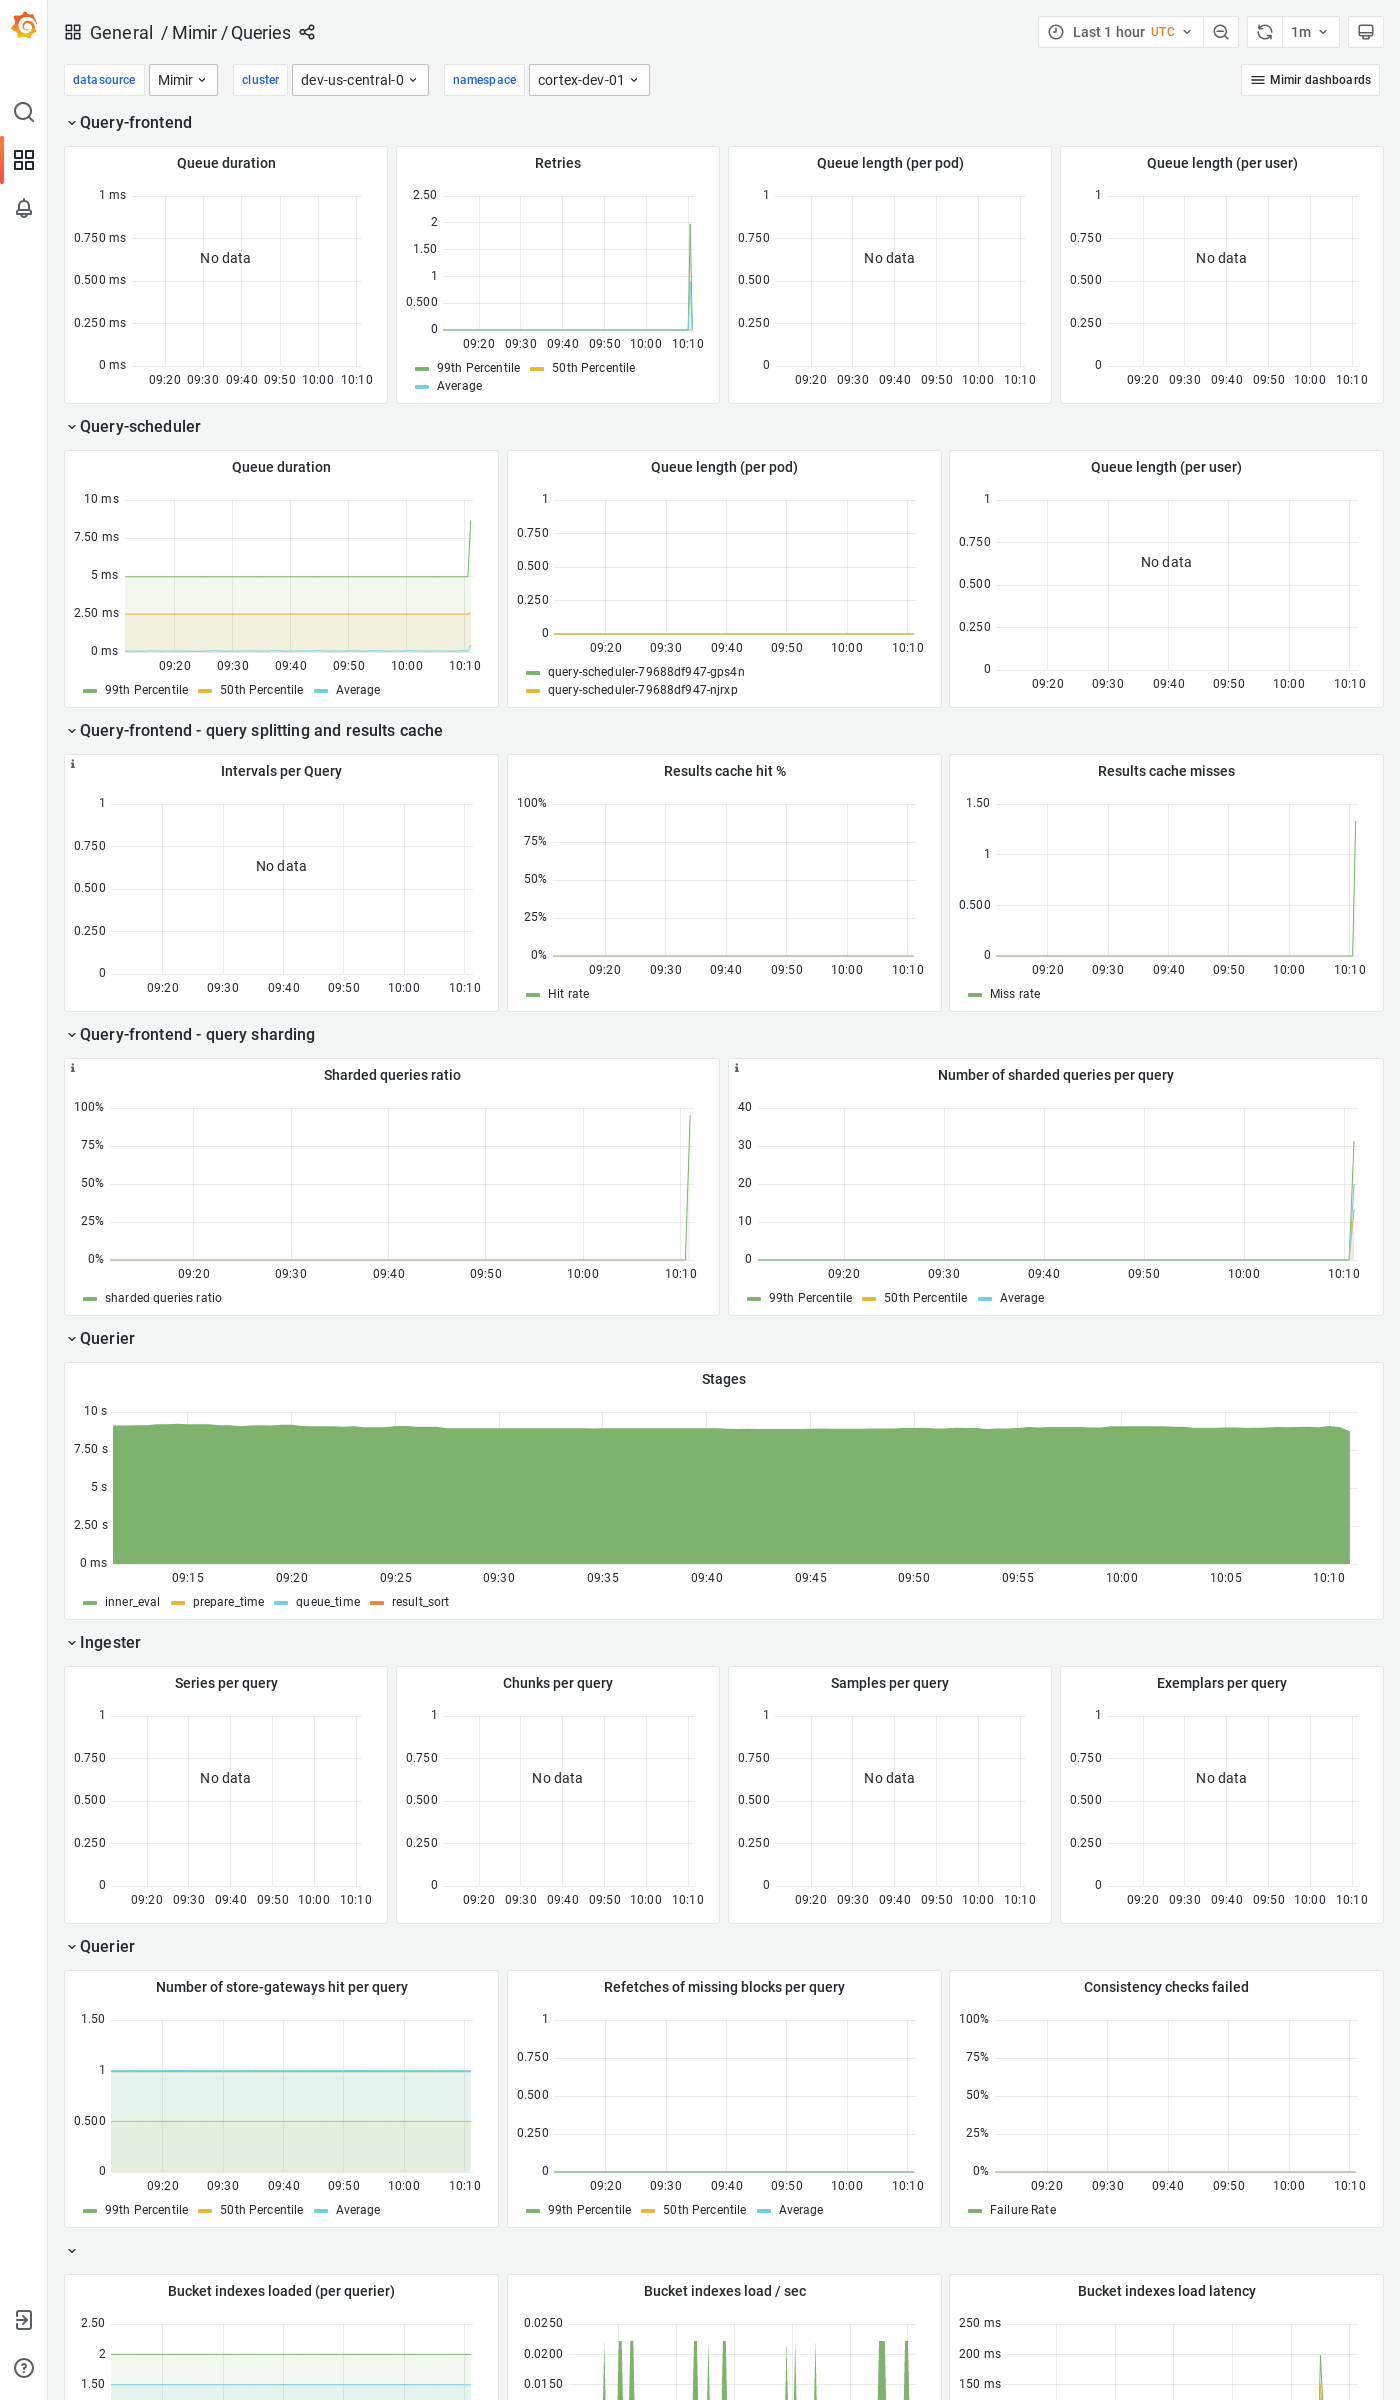
Grafana Mimir Queries dashboard
The Queries dashboard shows information about query queues, duration, retries, and details about query execution performance.
Example
The following example shows a Queries dashboard from a demo cluster.