Menu
This is documentation for the next version of Grafana Mimir documentation. For the latest stable release, go to the latest version.
Open source
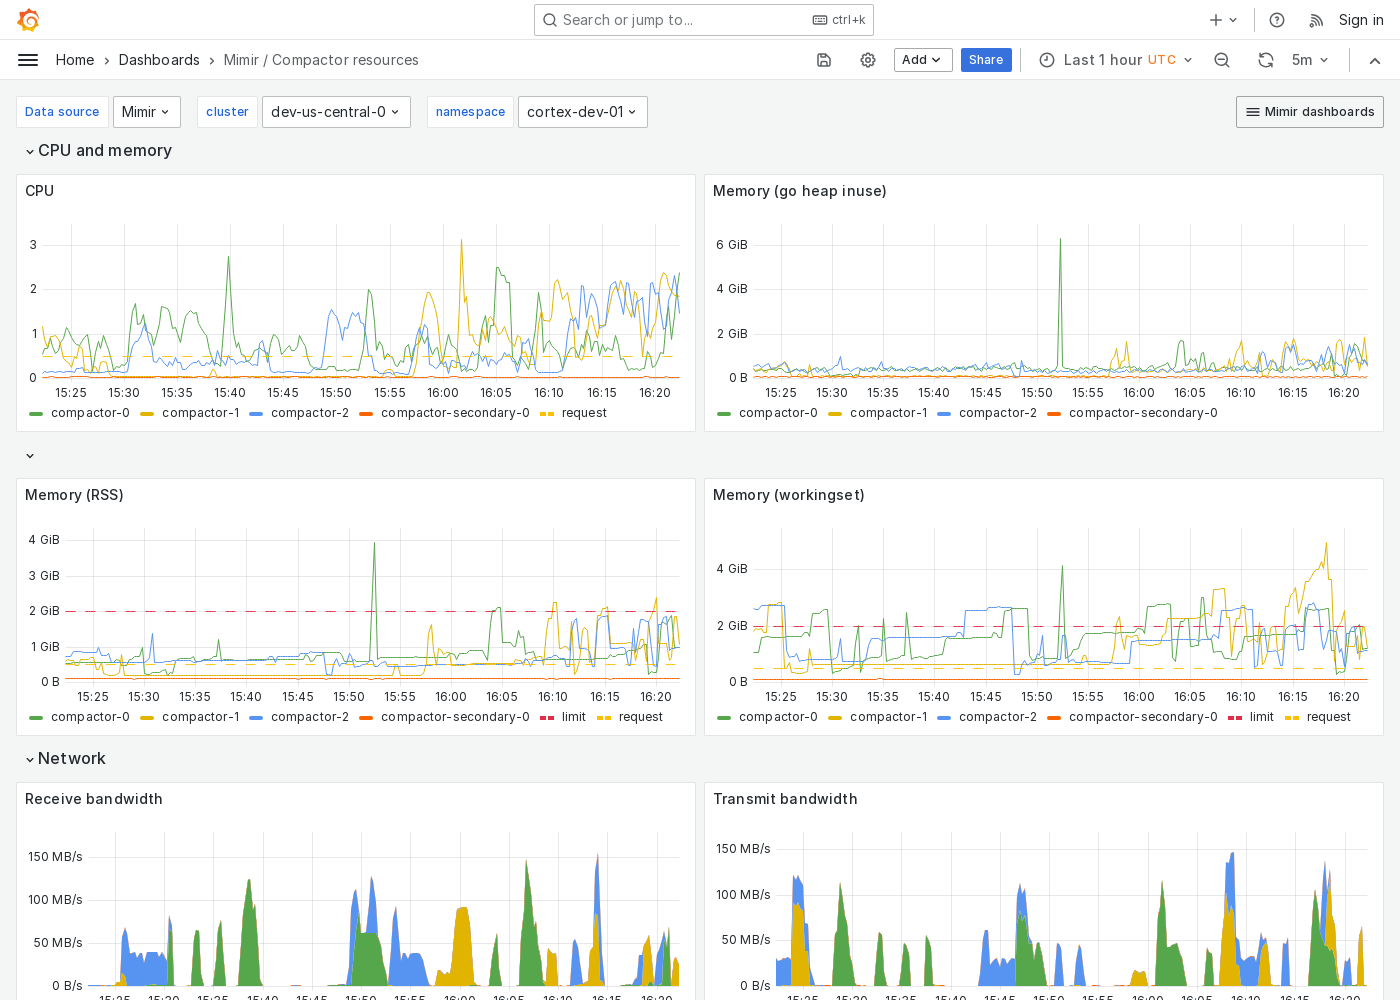
Grafana Mimir Compactor resources dashboard
The Compactor resources dashboard shows CPU, memory, disk, and networking metrics for the compactor.
Use this dashboard for the following use cases:
- Gain insight into the resource utilization of the compactor component within a Mimir cluster.
- Detect and analyze issues related to the compactor’s resource consumption.
- Optimize the compactor’s performance, ensuring efficient handling of compaction tasks without over-provisioning resources.
This dashboard requires additional resources metrics.
Example
The following example shows a Compactor resources dashboard from a demo cluster.