Important: This documentation is about an older version. It's relevant only to the release noted, many of the features and functions have been updated or replaced. Please view the current version.
Overview
Grafana Loki is a log aggregation tool, and it is the core of a fully-featured logging stack.
Loki is a datastore optimized for efficiently holding log data. The efficient indexing of log data distinguishes Loki from other logging systems. Unlike other logging systems, a Loki index is built from labels, leaving the original log message unindexed.
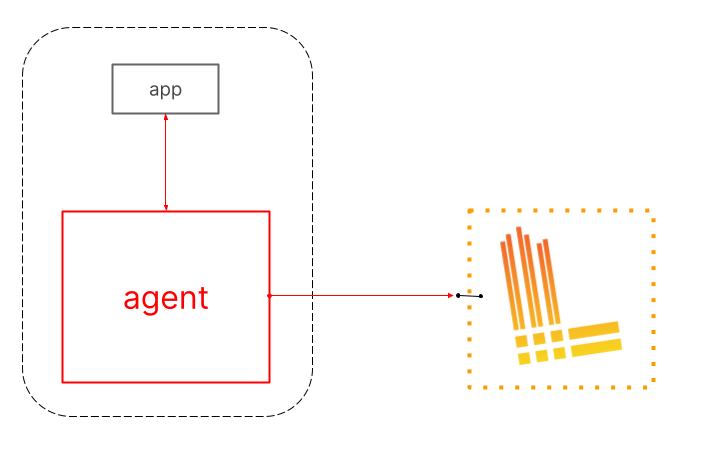
An agent (also called a client) acquires logs, turns the logs into streams, and pushes the streams to Loki through an HTTP API. The Promtail agent is designed for Loki installations, but many other Agents seamlessly integrate with Loki.
Loki indexes streams. Each stream identifies a set of logs associated with a unique set of labels. A quality set of labels is key to the creation of an index that is both compact and allows for efficient query execution.
LogQL is the query language for Loki.
Loki features
Efficient memory usage for indexing the logs
By indexing on a set of labels, the index can be significantly smaller than other log aggregation products. Less memory makes it less expensive to operate.
Multi-tenancy
Loki allows multiple tenants to utilize a single Loki instance. The data of distinct tenants is completely isolated from other tenants. Multi-tenancy is configured by assigning a tenant ID in the agent.
LogQL, Loki’s query language
Users of the Prometheus query language, PromQL, will find LogQL familiar and flexible for generating queries against the logs. The language also facilitates the generation of metrics from log data, a powerful feature that goes well beyond log aggregation.
Scalability
Loki can be run as a single binary; all the components run in one process.
Loki is designed for scalability, as each of Loki’s components can be run as microservices. Configuration permits scaling the microservices individually, permitting flexible large-scale installations.
Flexibility
Many agents (clients) have plugin support. This allows a current observability structure to add Loki as their log aggregation tool without needing to switch existing portions of the observability stack.
Grafana integration
Loki seamlessly integrates with Grafana, providing a complete observability stack.


