Trace service dependencies
In this milestone, you use distributed trace data to map service dependencies and identify affected services.
In RCA Workbench, traces are accessed through the Timeline view, providing instant trace context at any point in your investigation timeline. This helps you understand request flows and identify performance bottlenecks by analyzing trace spans for slow or failing requests.
To trace service dependencies, complete the following steps:
In RCA Workbench, locate the Timeline view.
Click a specific point in time on the Timeline where you want to investigate traces.
In the popup that appears, click Traces.
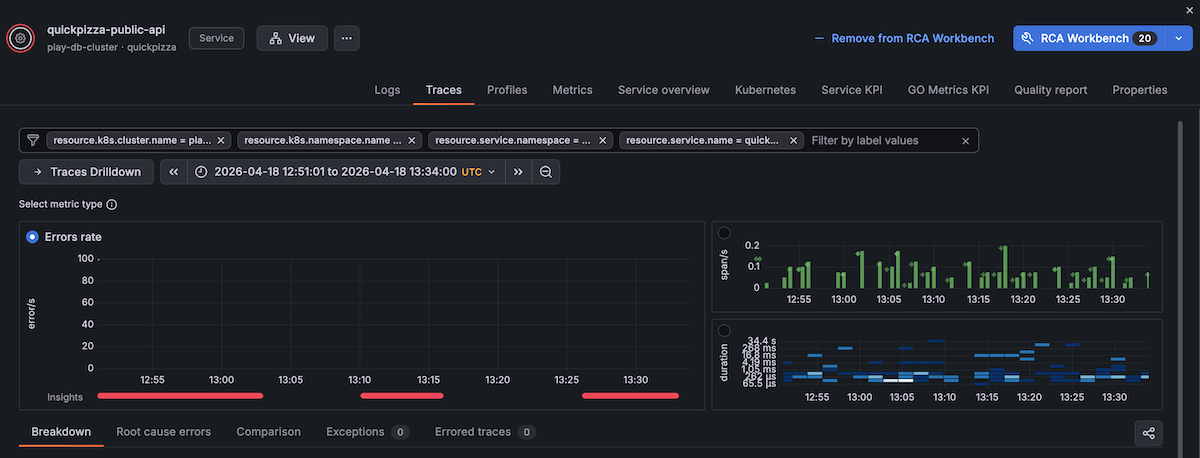
A drawer opens showing traces associated with that timestamp.
The traces view includes the following features:
- Pre-filtered traces for the selected entity and time
- Ability to click any trace to view details
- Option to open Traces Drilldown for deeper analysis
Review the service dependency map showing affected services.
Examine trace spans to identify services with increased latency or errors.
In a healthy trace, spans complete in milliseconds with no error tags. During an incident, look for spans that are significantly longer than their neighbours — a single span consuming 80% of the total trace duration usually points to the bottleneck. Also look for spans marked with error tags (often shown in red), which indicate where requests are actively failing rather than just slow.
Click on a trace to view the detailed span timeline.
Identify services where requests failed or experienced unusual delays.
If a single downstream service shows errors while its callers show increased latency but no errors, the downstream service is likely the root cause — callers are slow because they’re waiting on or retrying requests to the failing dependency. If errors appear across multiple services at the same level, look for a shared dependency such as a database, cache, or message queue that connects them.
Note the error rate and latency changes for each service during the incident.
You can see a service dependency graph with visual indicators showing which services experienced errors or latency increases, and access detailed trace spans for investigation.
In the next milestone, you’ll use Grafana Assistant to get AI-powered insights for root cause analysis.