View logs using Grafana Logs Drilldown
To view the logs in Grafana Logs Drilldown, complete the following steps:
Navigate to Drilldown > Logs.
The Logs Drilldown Overview page shows log visualizations and log samples for all the services in your selected Loki instance.
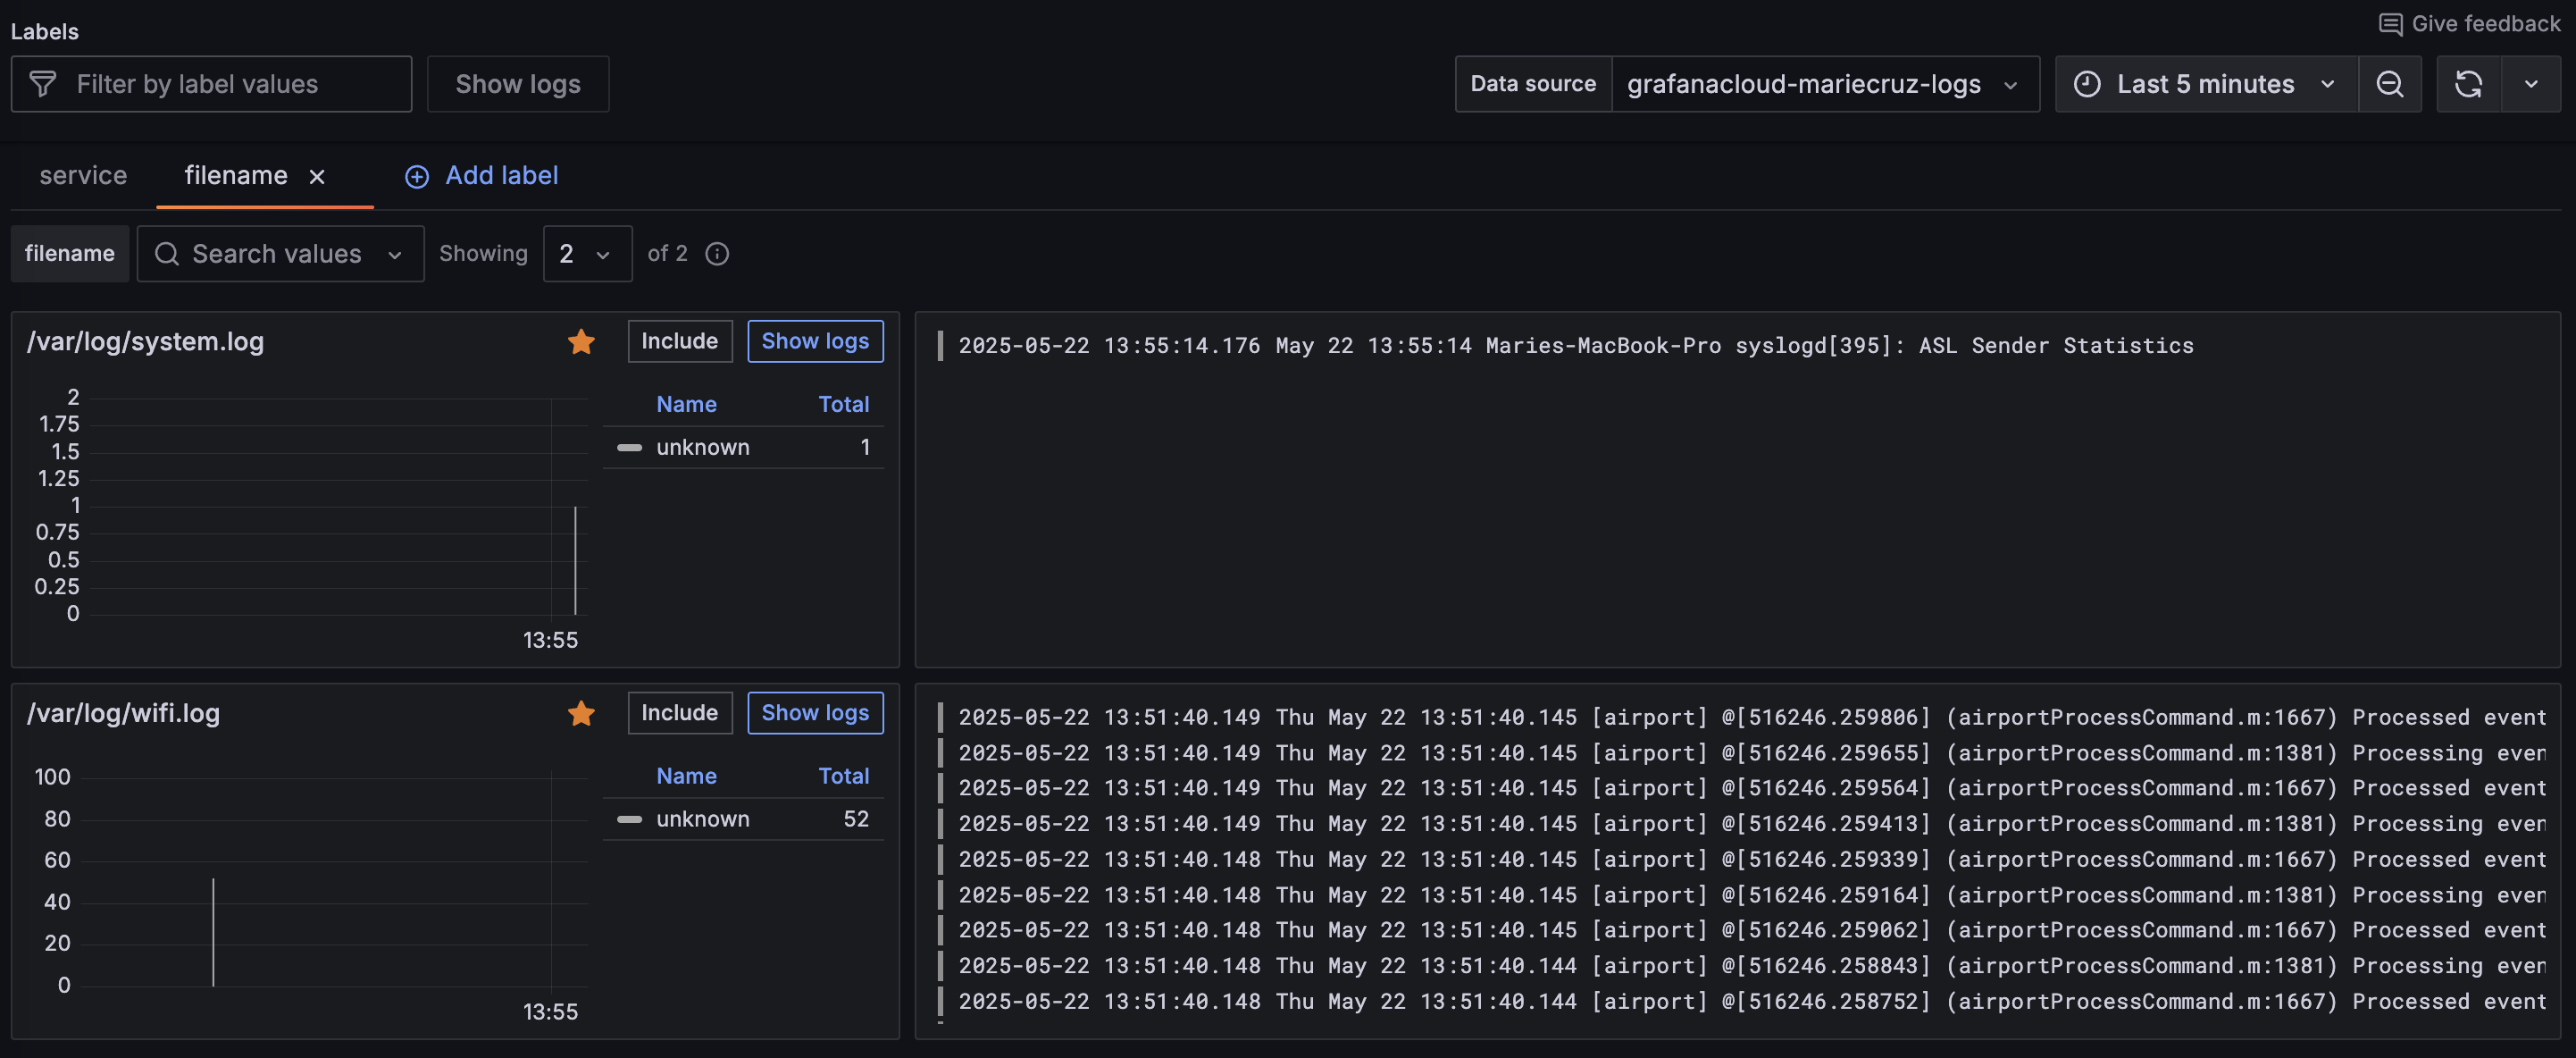
If you have multiple log files, you can view logs per file by clicking Add label and selecting
filename.The Logs Drilldown Overview page shows log visualization and log samples per file. You can see that logs are flowing through to Loki as expected, and the end-to-end configuration was successful.
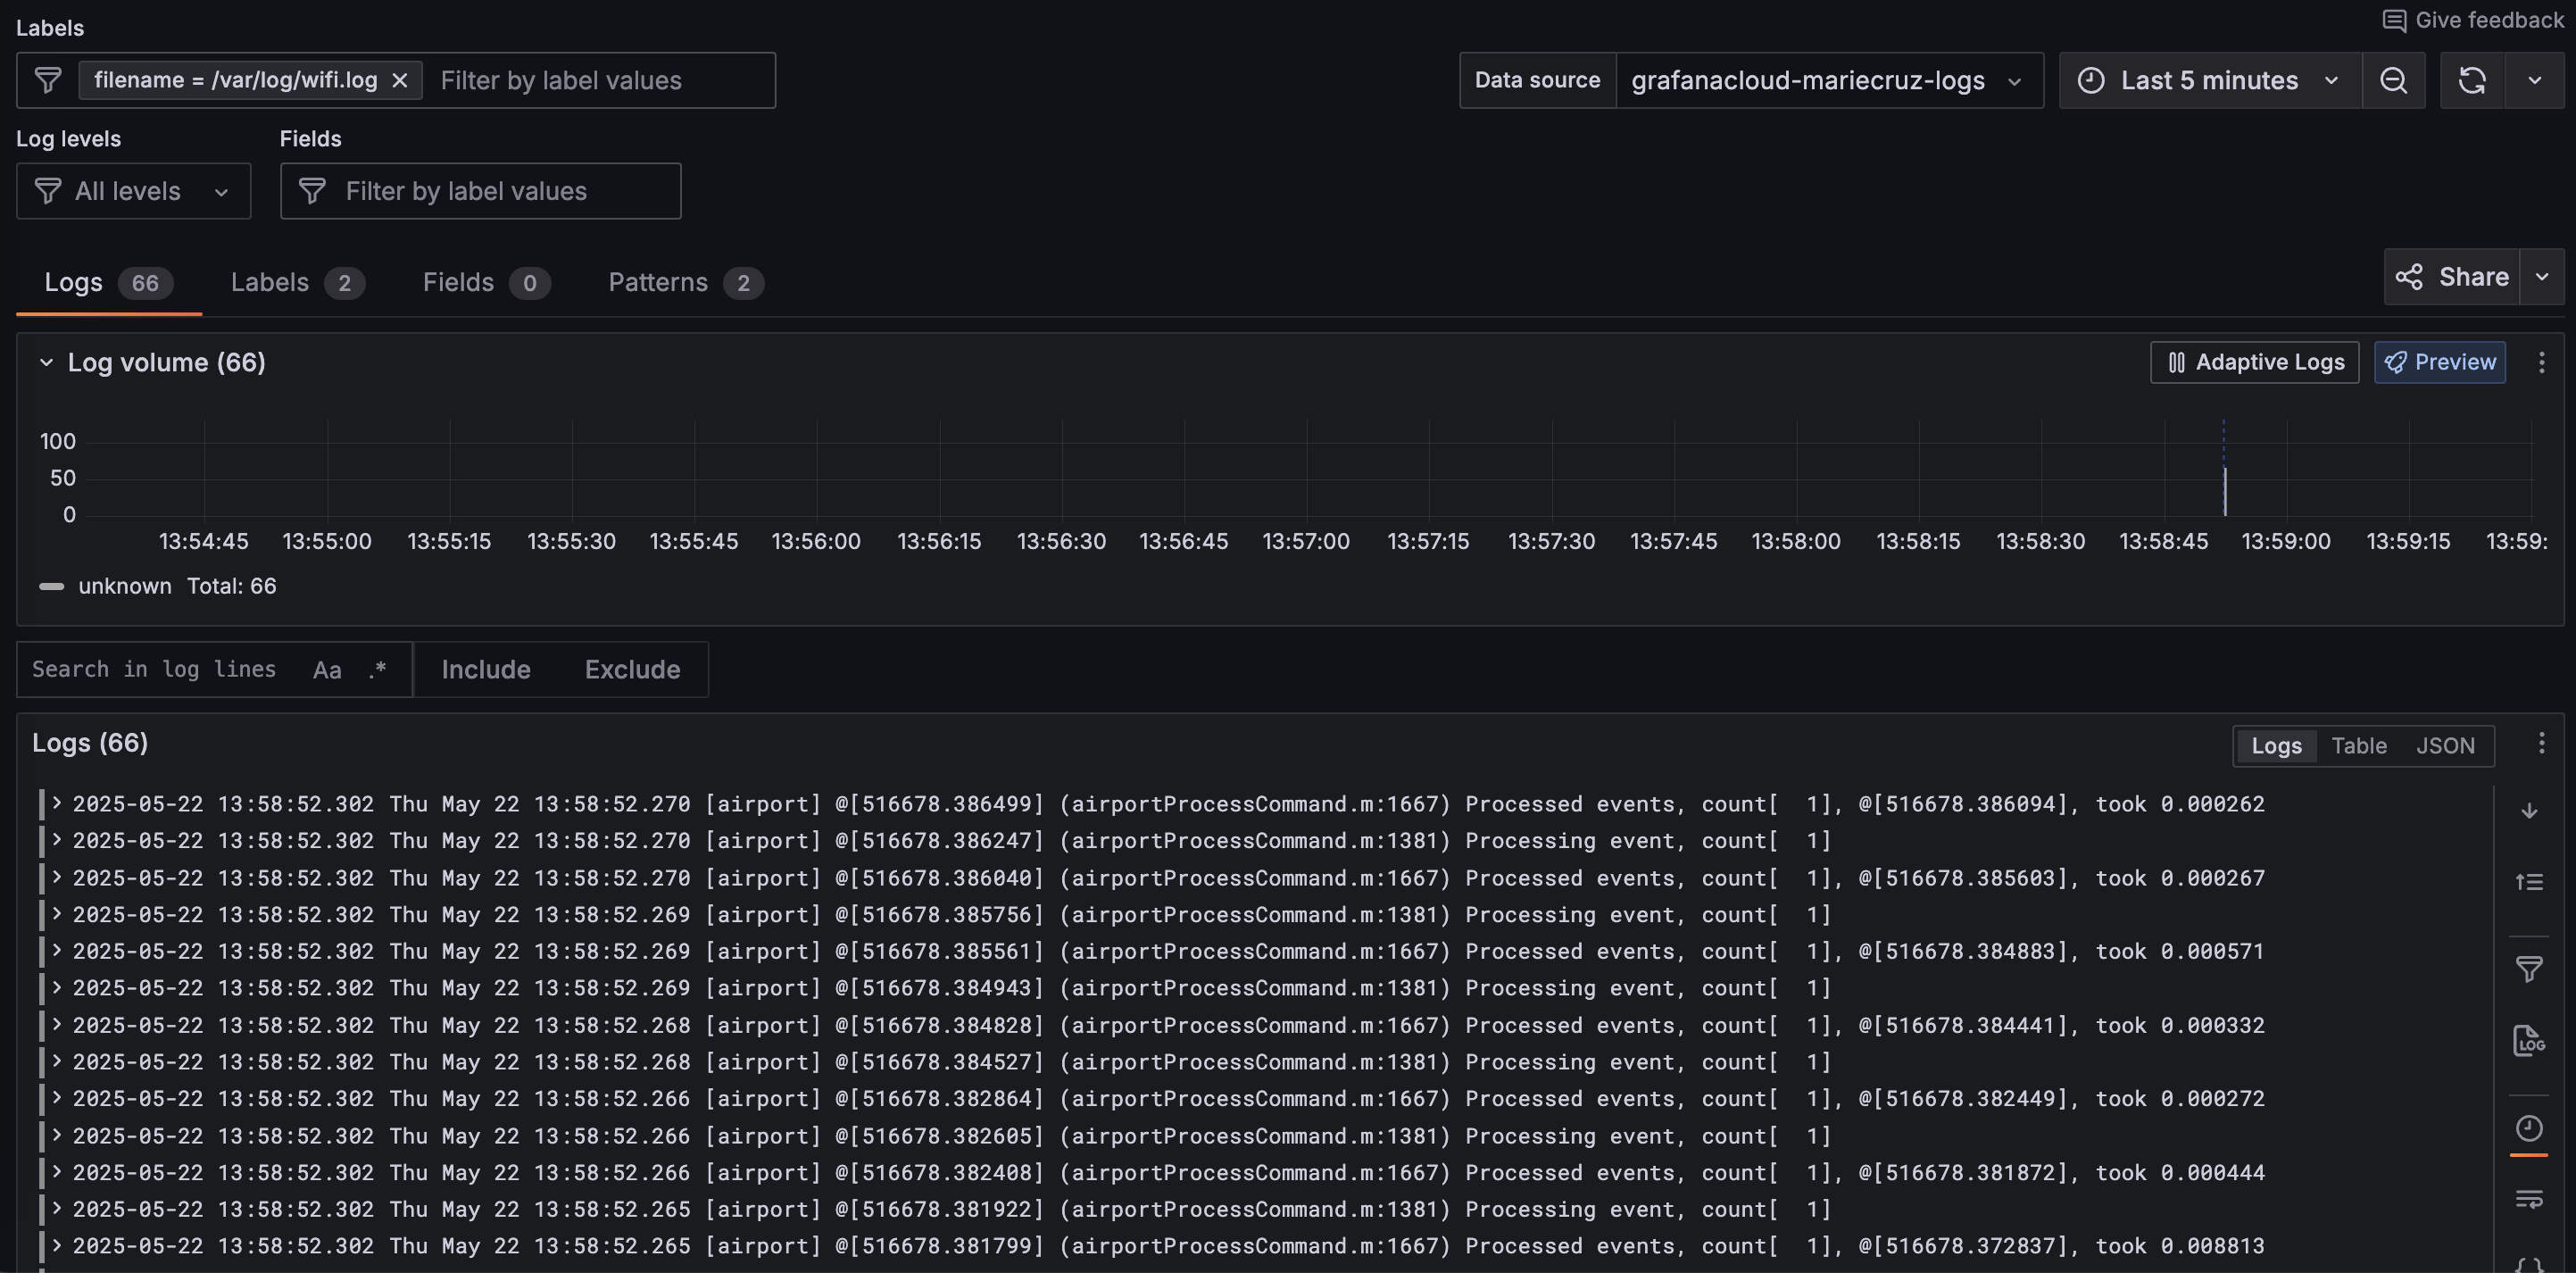
Select the log file you want to view and click Show logs.
Grafana displays the Logs tab for the selected file.
Troubleshooting
Explore the following troubleshooting topics if you need help:
Were you successful?
Super! You can move to the next step.
Please tell us what didn't work:
Need more support? Check out these helpful resources.
page 8 of 8