Inspect configuration file in Alloy
The Grafana Alloy UI is a lightweight, built-in web interface provided by Alloy to:
- Monitor Alloy’s internal status
- Debug data pipelines
- Inspect logs, metrics, and traces being collected or sent
- View configuration and component state
To inspect the components and your configuration file:
Open
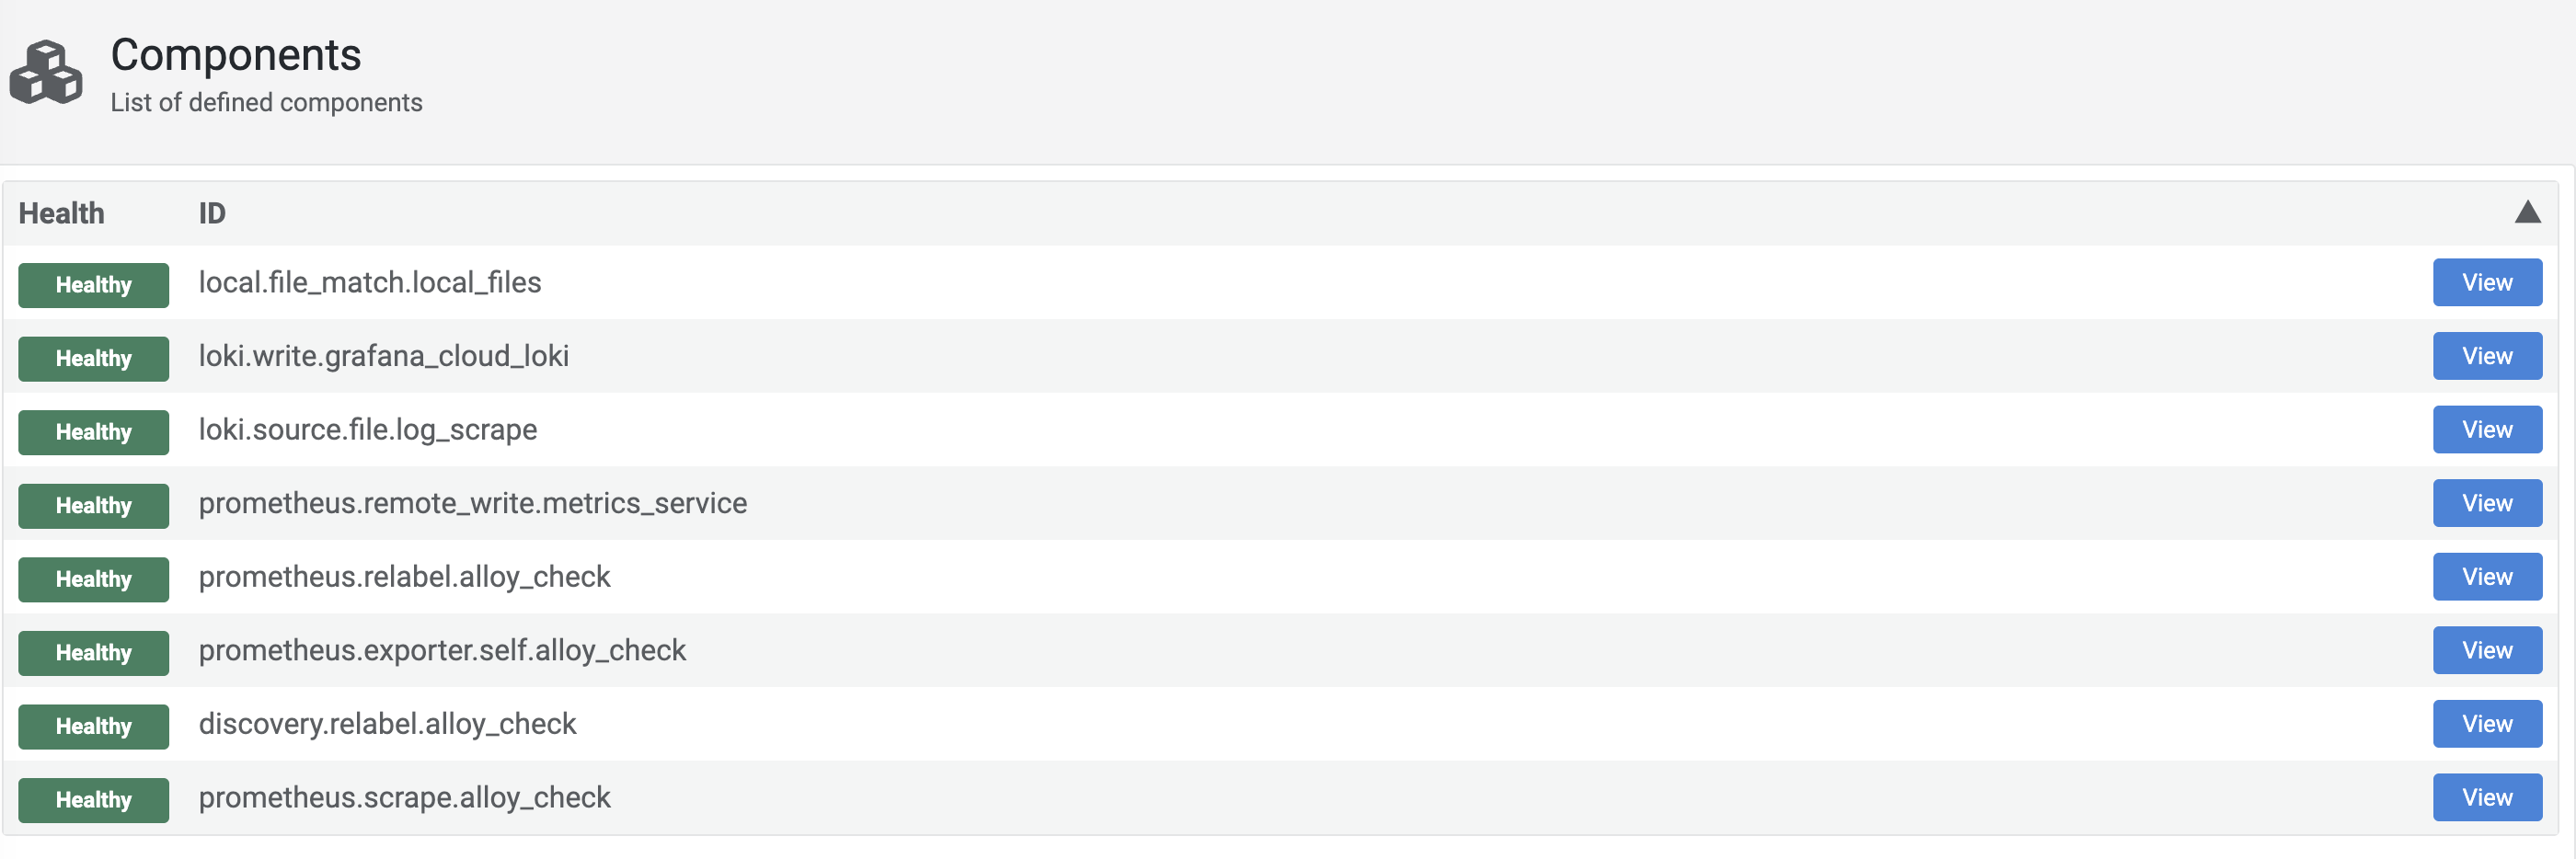
http://localhost:12345/in your browser of choice. By default, Alloy UI is served on port12345unless configured otherwise.You should see that all components are healthy if they are configured correctly.
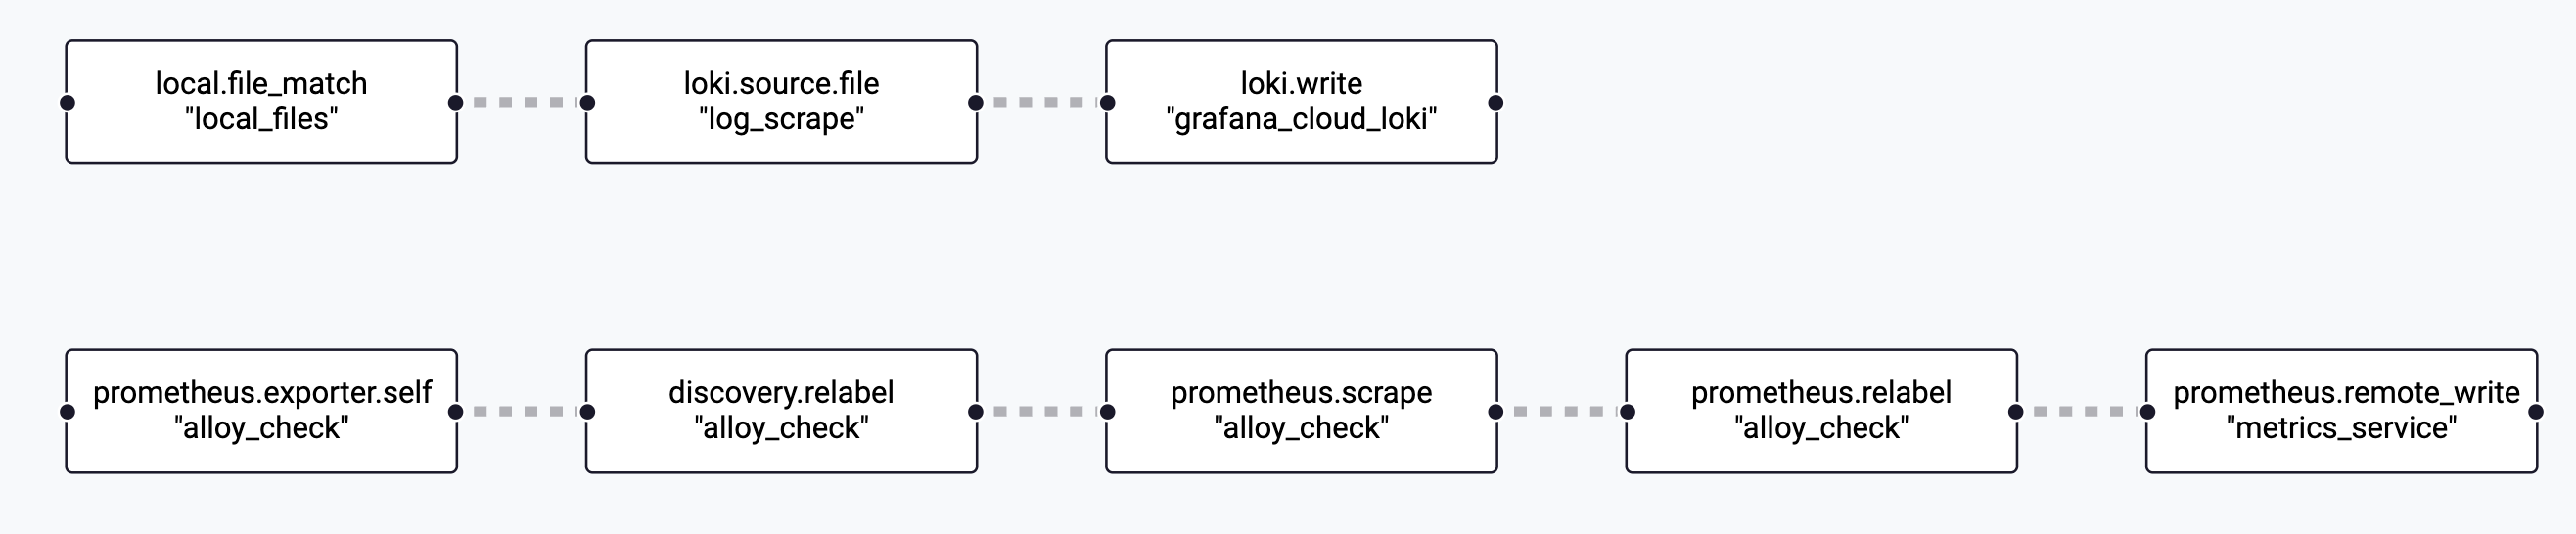
Click the Graph tab at the top.
You should see the following graph, which illustrates how the components are all connected.
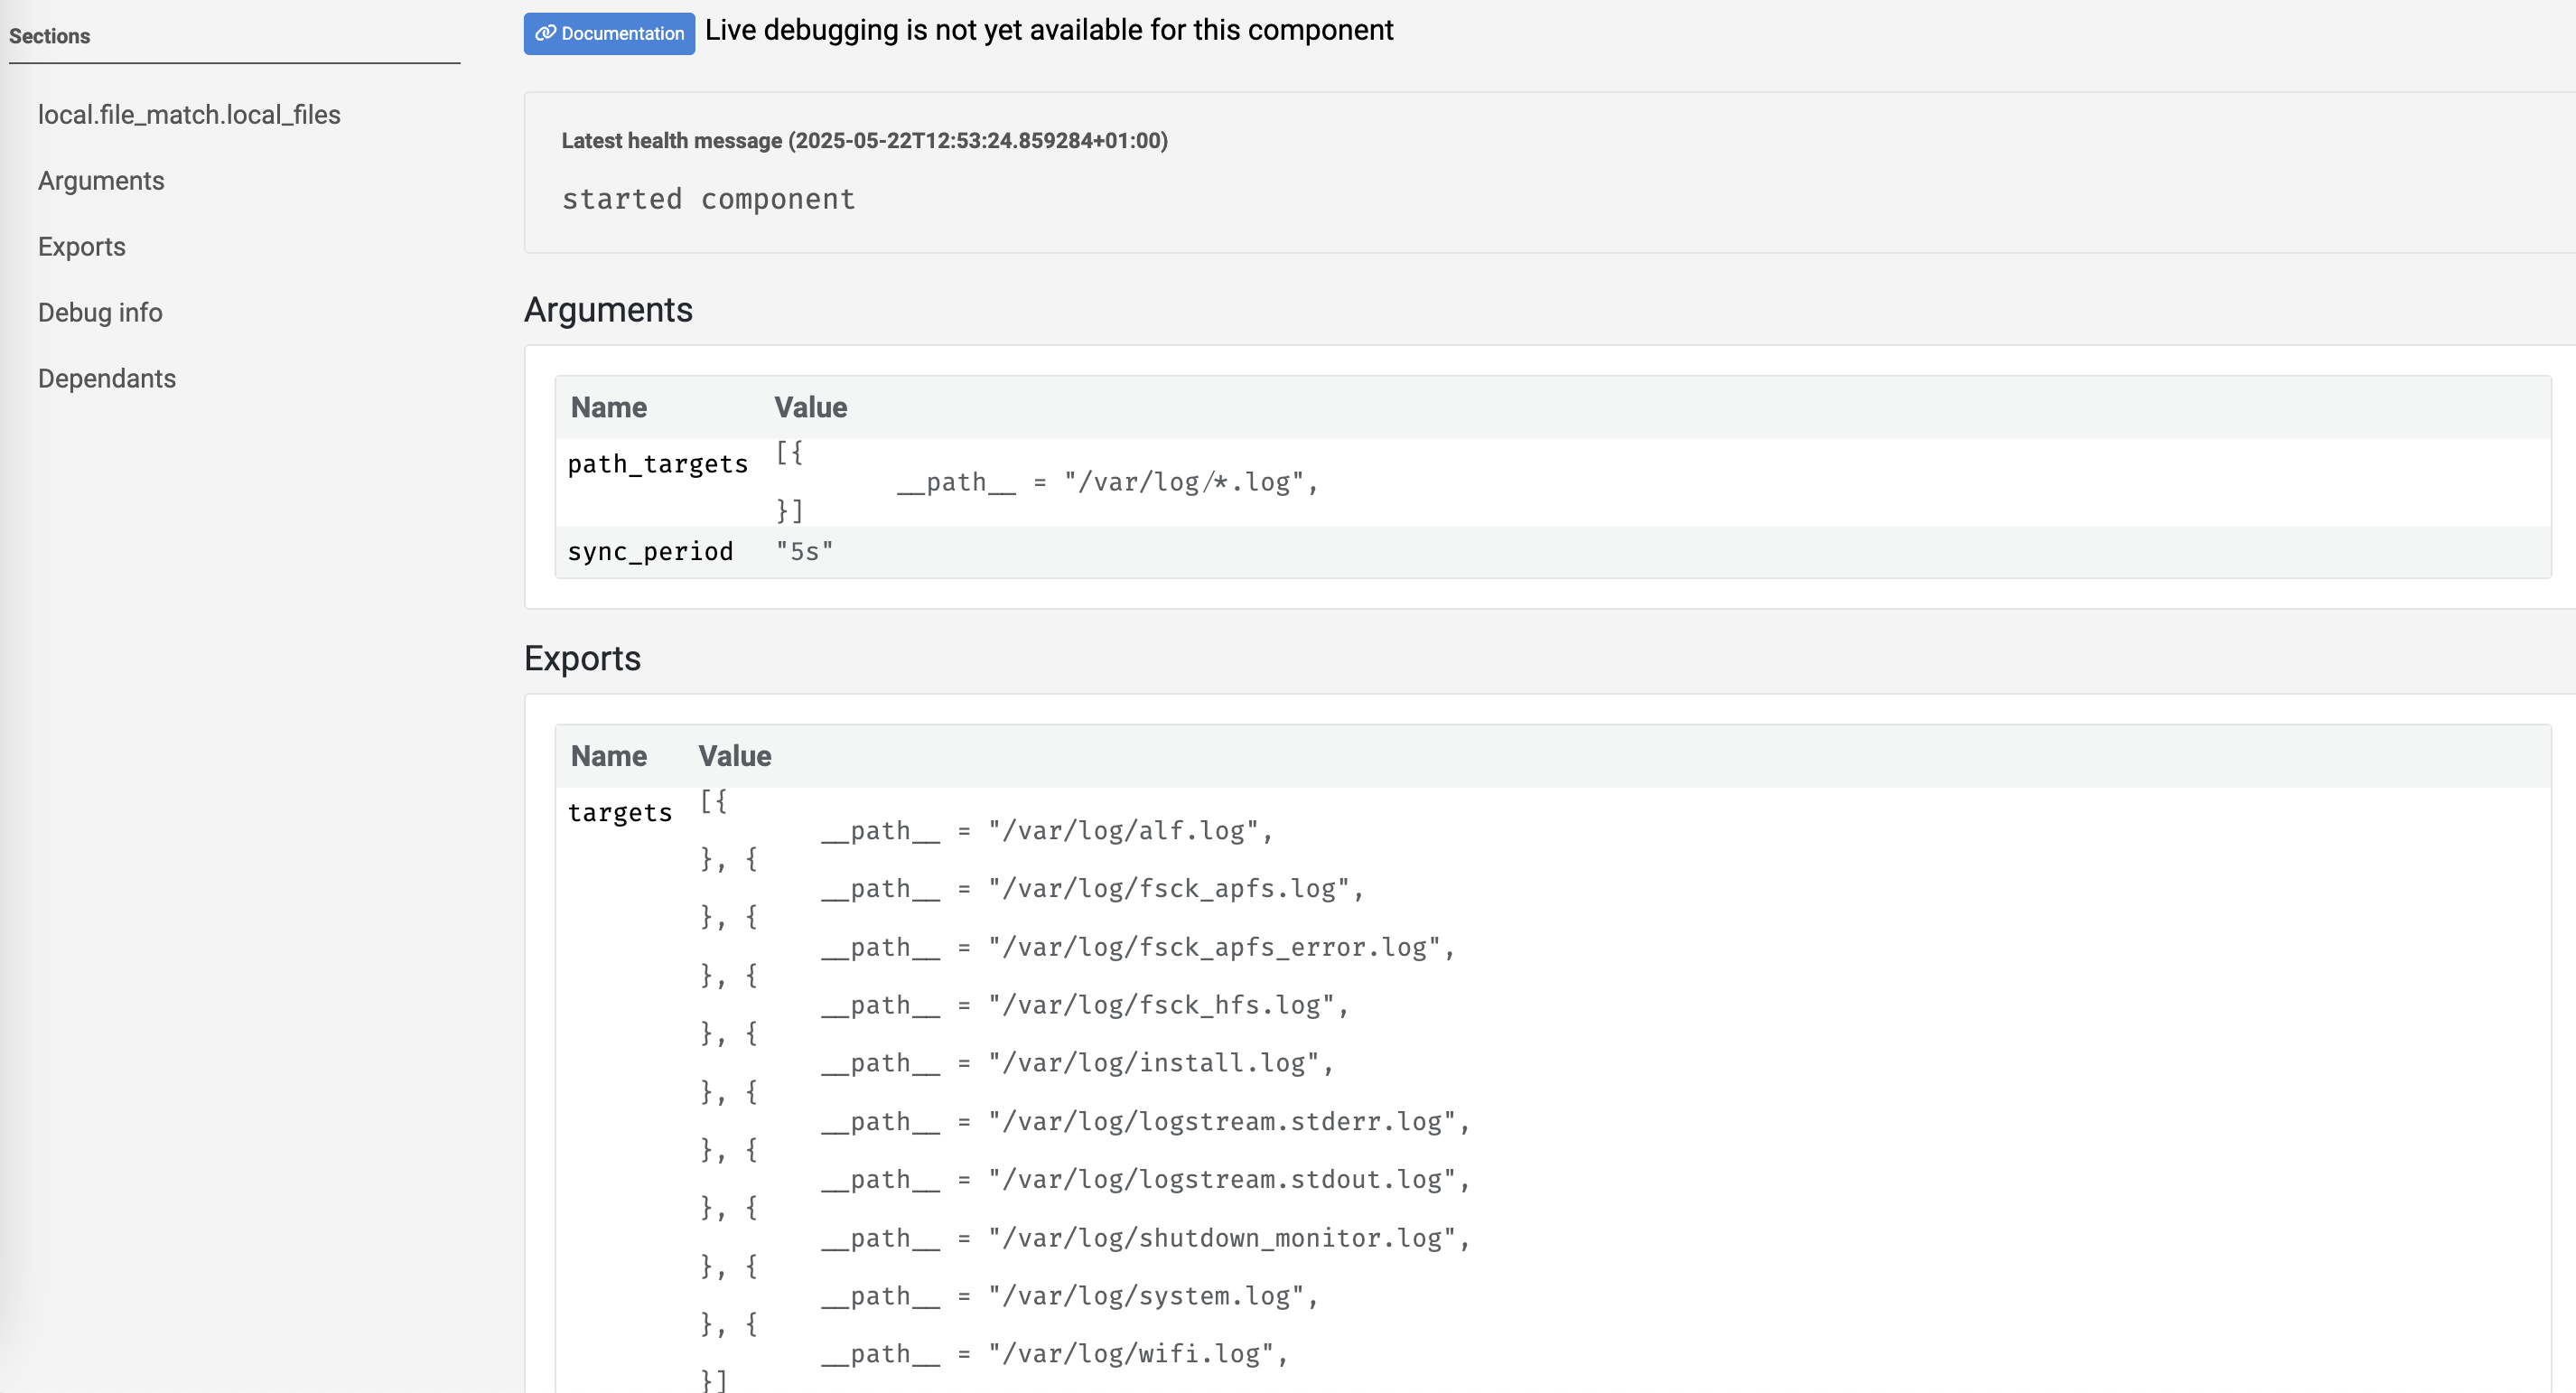
Click a component to view more information about its function.
In the following example, the
local.file_matchcomponent is selected. It shows all the log files that Alloy is sourcing.
In the next milestone, you’re going to view the logs exported to Loki in Grafana Cloud.
More to explore (optional)
At this point in your journey, you can explore the following paths: