Select data to collect
In this step of your journey you select which data you want to collect from your Kubernetes cluster.
While there are many different types of data you can collect, this journey focuses on just a few to get you started. Be aware that activating more toggle switches can increase your metrics consumption, and ultimately, your bill.
To select data to collect, complete the following steps:
Cluster name: In the Cluster name box, enter the name of your Cluster.
If you don’t know the Kubernetes cluster name, you can get the name of the cluster for your current Kubernetes context by running this command in the terminal:
kubectl config view --minify -o jsonpath='{.clusters[].name}{"\n"}'Namespace: In the Namespace box, replace
defaultwith the namespace where you want to deploy your monitoring infrastructure. This is the namespace for Grafana Alloy and other dependencies such as kube-state-metrics.Platform: Select the platform you are using.
- Kubernetes, including Amazon Elastic Kubernetes Service (EKS) on Amazon Elastic Cloud Compute (EC2) and Google Kubernetes Engine (GKE)
- Amazon EKS on AWS Fargate. Node Exporter metrics are disabled. Instead, the Kubernetes API is used to collect Pod logs.
- Azure Kubernetes Service (AKS)
- Google Kubernetes Engine (GKE) Autopilot. Node Exporter metrics are not supported on this platform.
- IBM Cloud Kubernetes Service
- Red Hat OpenShift
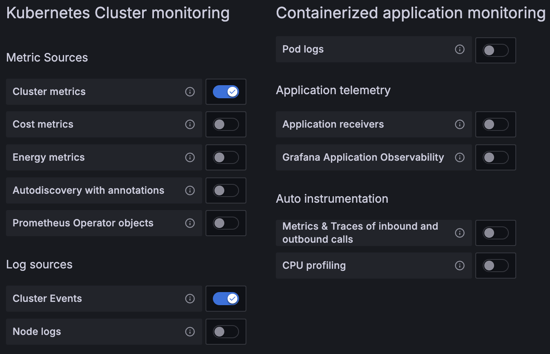
In the Kubernetes Cluster monitoring section, turn on the Cluster metrics and Cluster Events toggles.
Caution
No other toggles are required. If selected, they might increase your metrics consumption.
The following image shows what your feature monitoring selections should look like:
At this point in your journey, you can explore the following paths:
Understand cluster events and how Kubernetes Monitoring collects them