The advantages of Grafana Kubernetes Monitoring
Grafana Kubernetes Monitoring provides the following advantages:
Priority issues at forefront
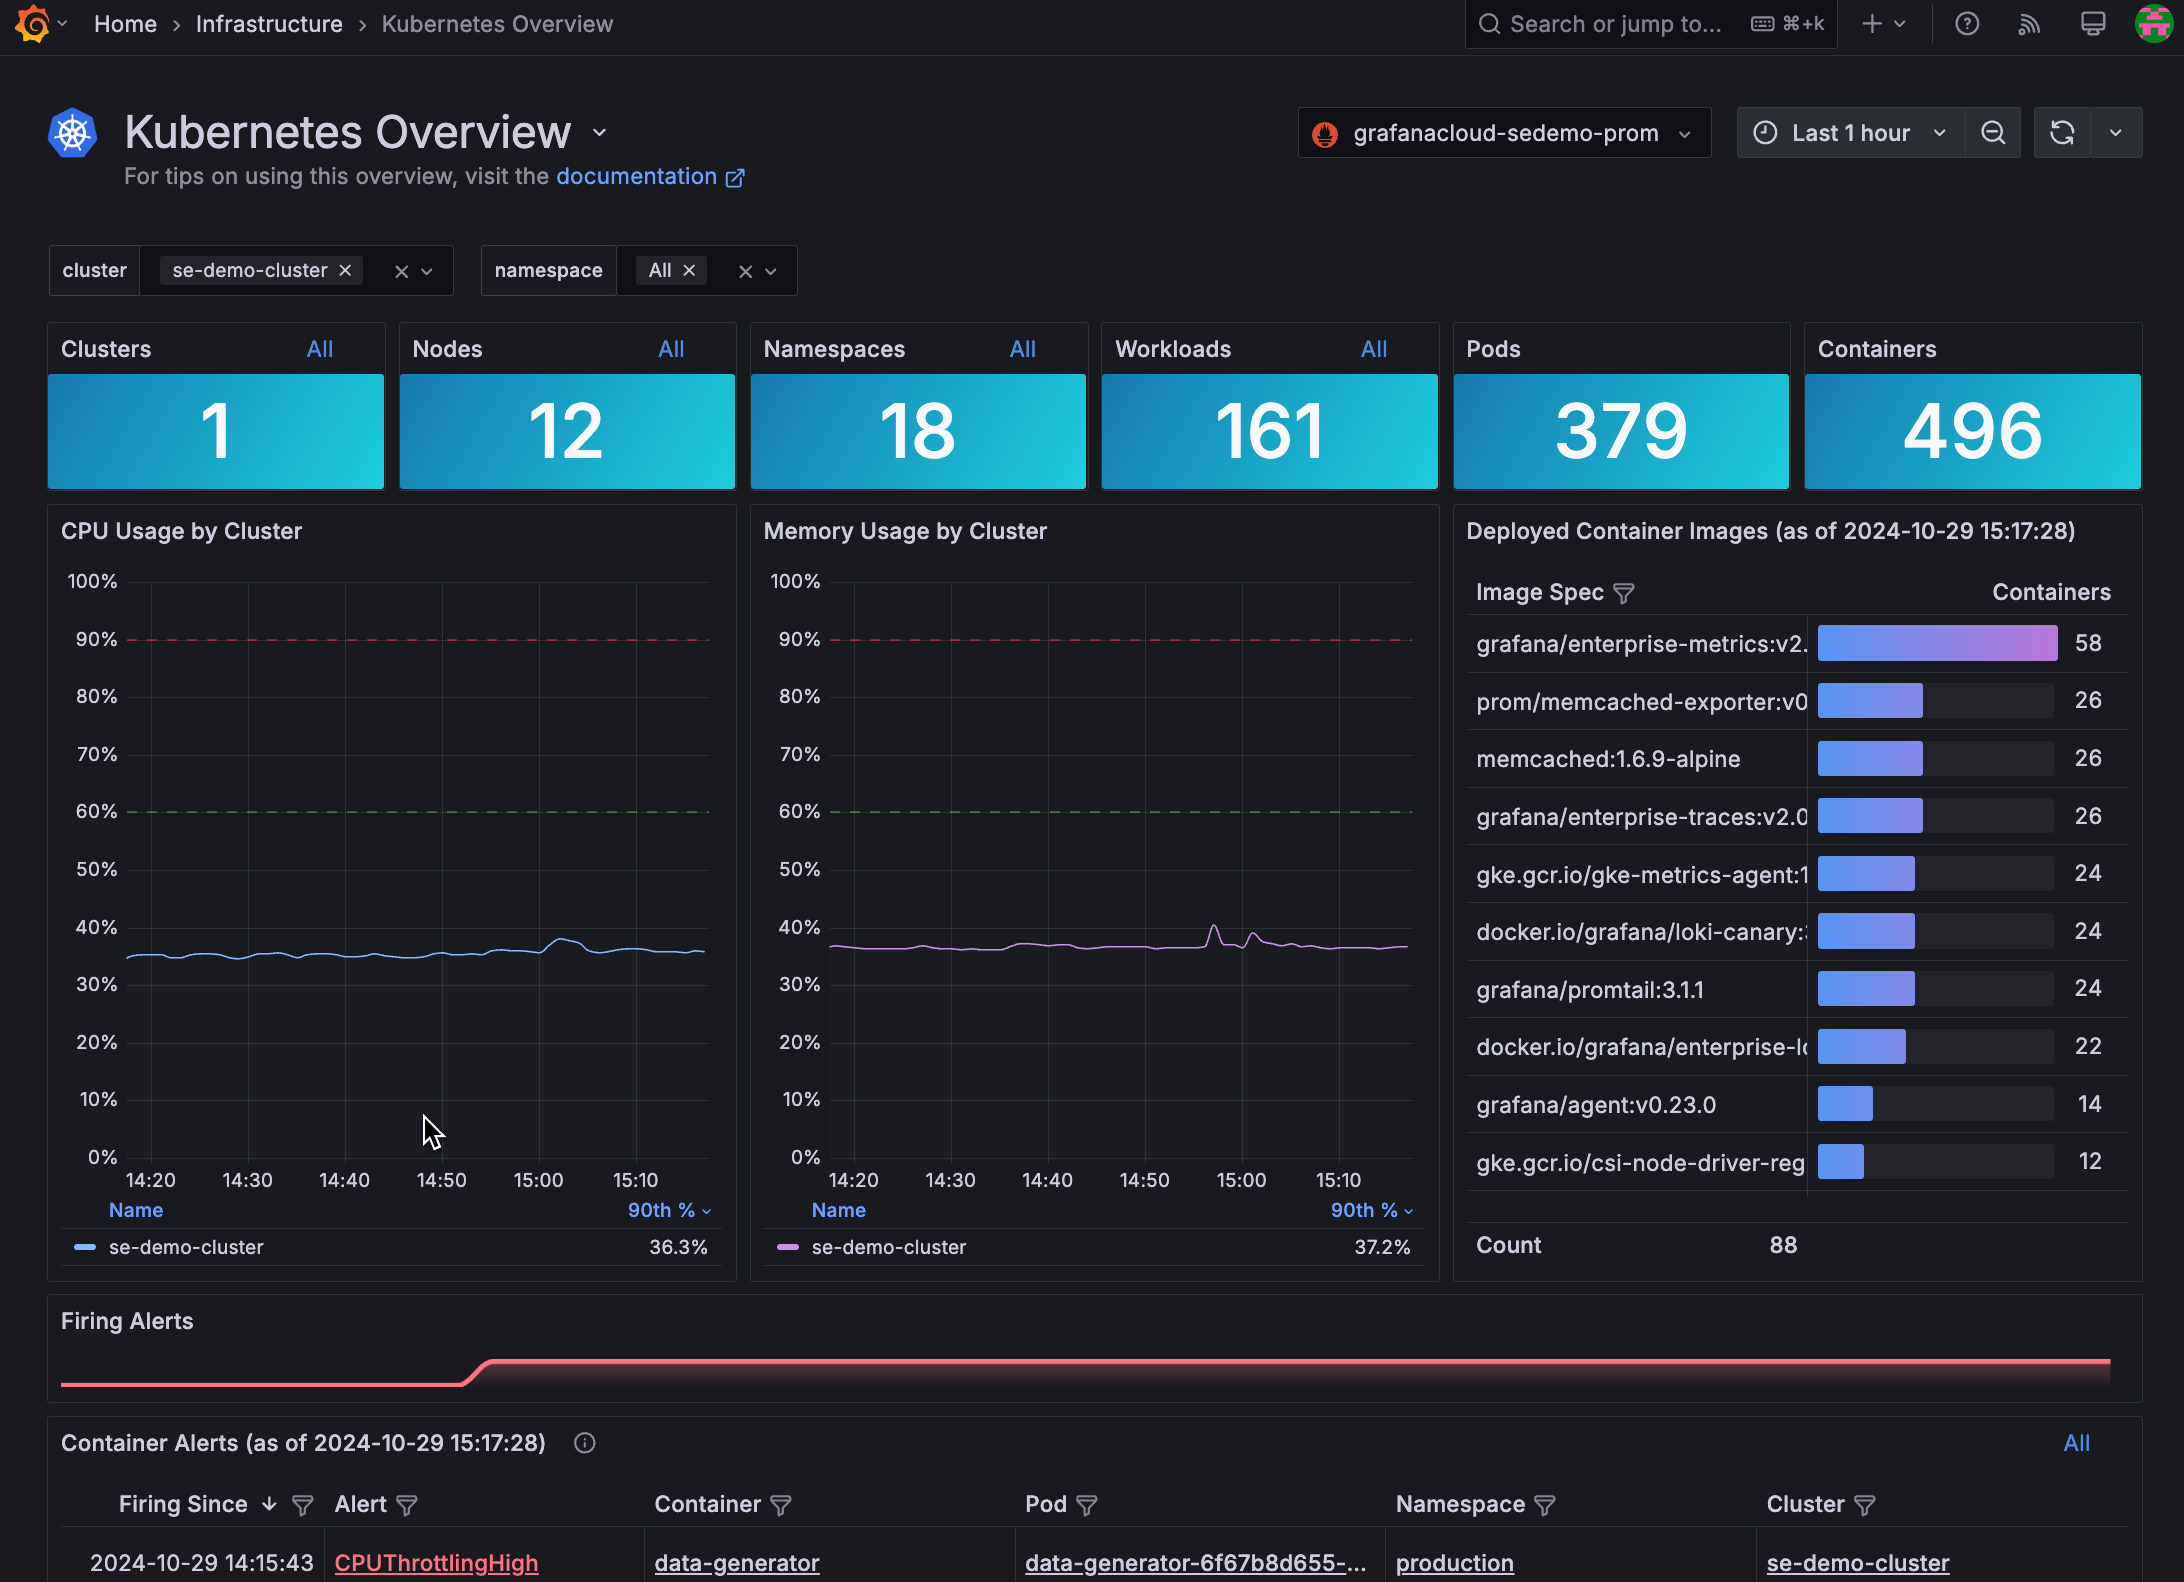
The Kubernetes Overview page provides a high-level look at counts for Kubernetes objects, CPU and memory usage by Cluster, and firing alerts for containers and Pods. You can filter this view by Clusters and namespaces, then identify issues that require attention to begin your problem solving.

Real-time alerts
Real-time alerts inform you as soon as problems begin. You can jump from alert to runbook for a quick solution, create your own alerts, and copy a built-in alert to customize it.
Logs and metrics correlation
While Kubernetes doesn’t provide a native storage solution for logs, Kubernetes Monitoring uses Grafana Loki as its log aggregator. Since Loki and Prometheus share labels, you can correlate metrics and logs to identify root causes faster without configuring and using multiple technologies.
Early error detection
You can use built-in alerting for issues such as CPU throttling to learn which settings need fine tuning. Network bandwidth and saturation is available by object. The time range selector in Kubernetes Monitoring provides a look into the history of an object, which shows patterns such as spikes. Outlier Pod detection can find Pods with CPU usage differences that may lead to issues.
Cost visibility and management
Nodes, load balancers, and Persistent Volumes usually cost extra from your provider, making it important to keep track of them. Auto-scaling architectures let you adapt in real-time to changing demand, but can lead to rapidly rising costs. Kubernetes Monitoring shows these costs so you can decide what costs can be reduced. With cost prediction, you can view potential, future costs.
Resource efficiency management
You can reduce the risk of an unstable infrastructure by monitoring resource usage to:
- Ensure that there are enough allocated resources and decrease the risk of Pod eviction, as well as prevent declining performance of your microservices and applications.
- Eliminate unused or stranded resources.
Then you can make scheduling adjustments, such as setting affinities and anti-affinities, to improve performance and reliability.
Resource usage forecasts
By looking at a prediction of resource usage, you can better forecast for a project or activity.