View slowest traces
Investigating the slowest traces can help you identify bottlenecks and inefficiencies in your system. These traces often highlight areas where requests are taking longer than expected, which can directly impact user experience and system performance.
By analyzing these traces, you can:
- Pinpoint specific services or components causing delays.
- Uncover patterns or recurring issues that may indicate deeper problems.
- Prioritize optimizations that will have the greatest impact on performance.
- Ensure your system meets performance expectations and service level objectives (SLOs).
Understanding and addressing the root causes of slow traces helps maintain a reliable and efficient system, ultimately improving user satisfaction and reducing operational costs.
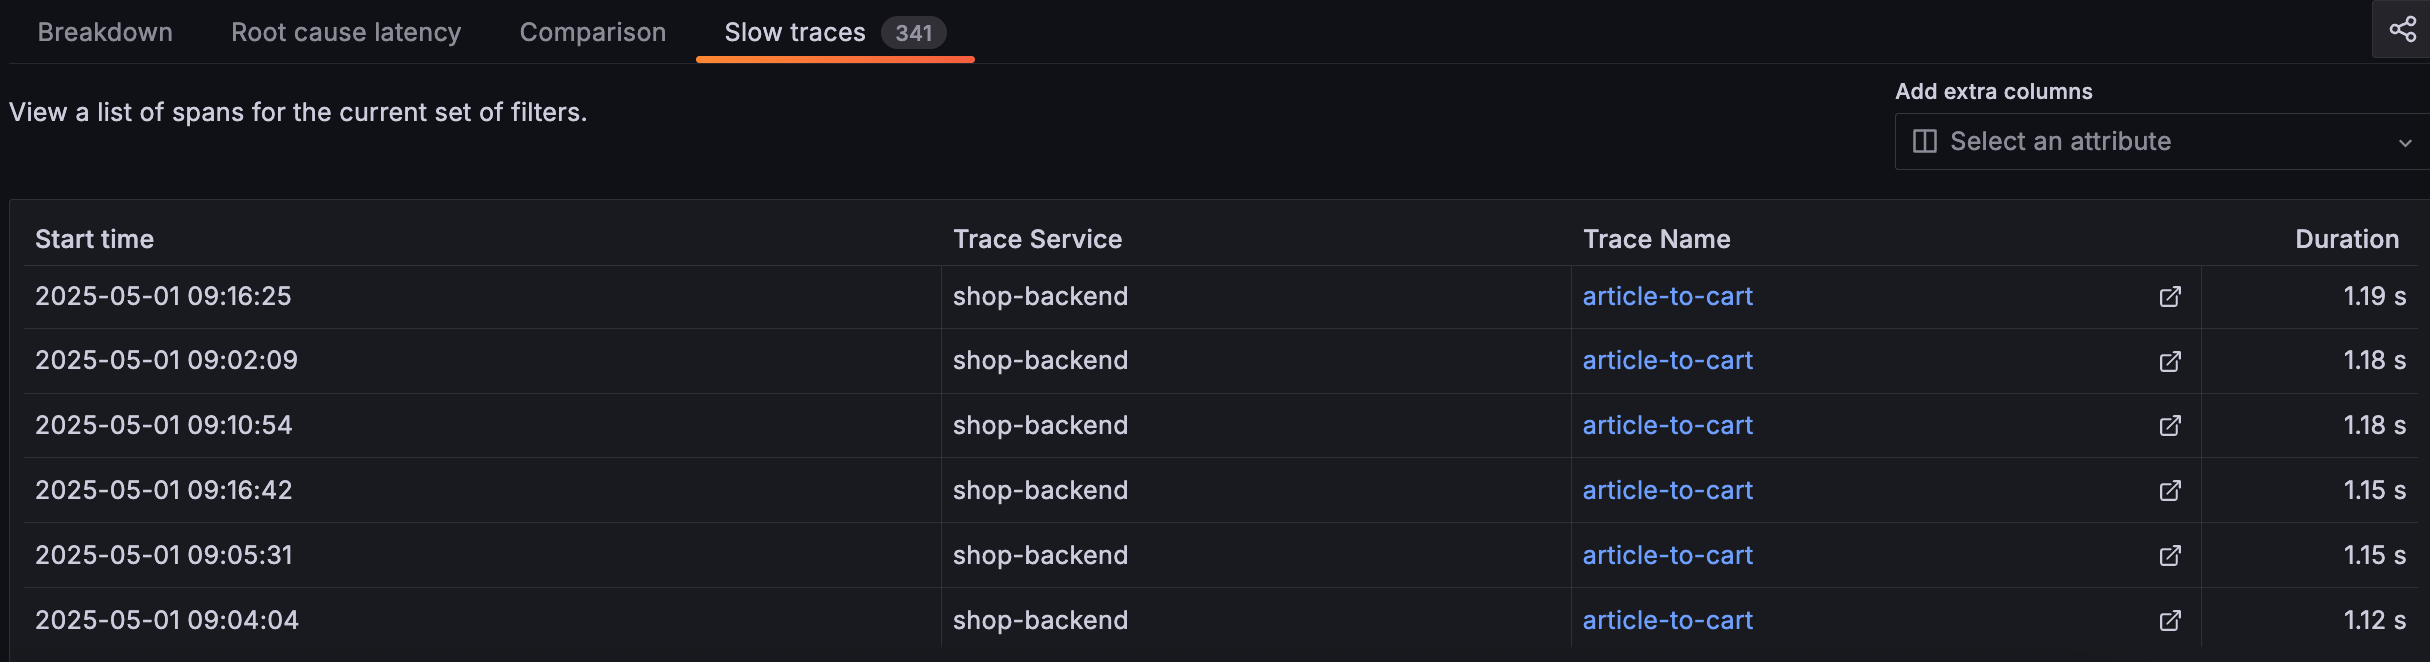
To view the slowest traces, click the Slow traces tab.
The image below provides the following insights:
- All slow traces are associated with the
shop-backendservice, specifically thearticle-to-cartoperation. This indicates that the performance issue is localized to this service and operation. - The slow traces have durations ranging from 1.12 seconds to 1.19 seconds. This suggests a consistent delay pattern rather than sporadic spikes.
- Multiple slow traces are recorded within a short time span, indicating that the issue is recurring and not an isolated incident.
- The slow traces occur at different times (for example, 09:02:09, 09:16:25), suggesting the issue isn’t tied to a specific time window but may be related to the operation itself or its dependencies.
In the next milestone, you’ll drill down into a trace to see all associated trace spans.
page 4 of 7