View distribution of trace span durations
Your first milestone in understanding traces and system performance is to view the distribution of trace span durations.
Viewing the distribution of trace span durations helps you:
- Spot spans with unusually high durations that may indicate bottlenecks or performance issues.
- Analyze the overall performance trends of your system, such as whether most spans fall within an acceptable range.
- Link high-duration spans to specific services, endpoints, or attributes to uncover root causes.
- Focus on spans with the greatest impact on user experience or system performance.
To view the distribution of trace span durations, complete the following steps:
On the Grafana Cloud home page, open the navigation menu and click Drilldown > Traces.
Select the data source you want to explore. The Traces Drilldown user interface appears.
On the Filters toolbar, click All spans.
Click the Histogram by duration panel. The panel moves to the center of the page.
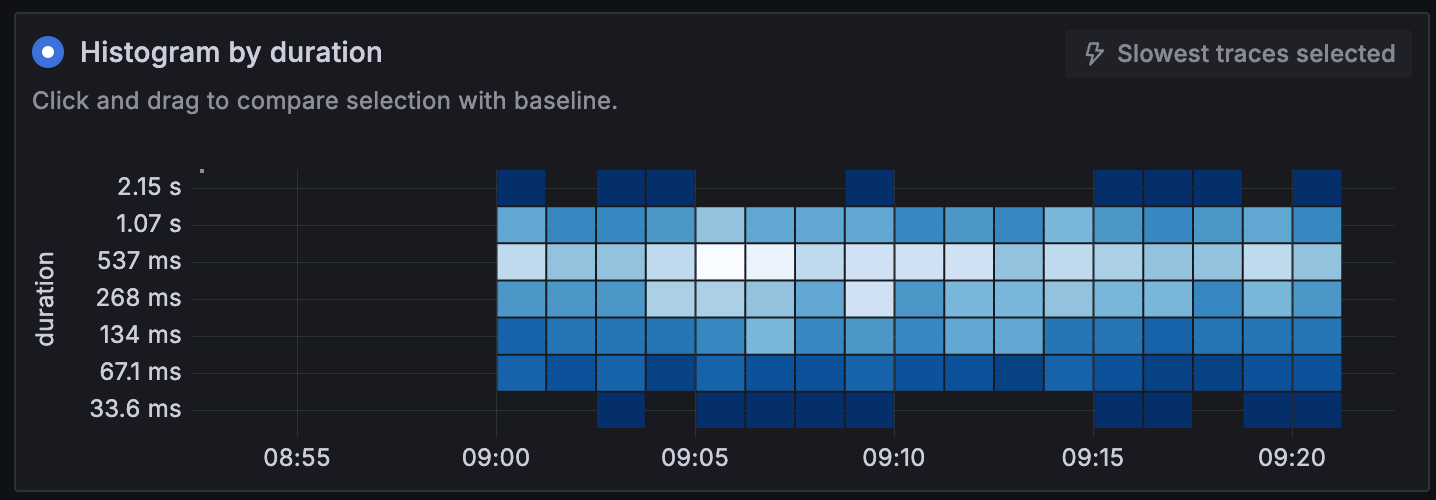
The following image provides the following insights:
- The histogram shows the distribution of request durations over time. Most requests fall into shorter duration buckets (for example, 33.6 ms to 134 ms), but there are occasional longer durations (for example, up to 2.15 s).
- Darker blocks represent fewer spans falling into a specific duration bucket. For example, at 9:00 AM, only 1-2 spans likely fell into the 2.15-second bucket. In contrast, the majority of spans fell into shorter duration buckets, such as the 537-millisecond bucket, which is represented by lighter-colored blocks.
- The system exhibits variability in response times. This could indicate inconsistent performance, possibly due to resource contention, traffic spikes, or backend issues.
In the next milestone, you’ll generate a list of the slowest traces so that you can begin identifying specific operations or services causing delays.