Investigate a span
In this milestone, you navigate to the details of a trace span, which provides the following insights:
- Identify which segments of a span are on the critical path of the overall trace workflow.
- Spans often contain events or exceptions that help you identify the root cause of failures.
- Spans provide success or failure status.
- By analyzing the duration of individual spans, you can pinpoint slow operations or services contributing to latency.
- Span attributes, such as database queries or external API calls, reveal how resources are used and where inefficiencies exist.
- Spans show how different services and components interact, helping you identify problematic dependencies or cascading failures.
- Spans include timestamps for key events, allowing you to reconstruct the sequence of operations and understand the context of an issue.
To see the details of a span, in the Service & Operation view, expand the span to access additional information and insights.
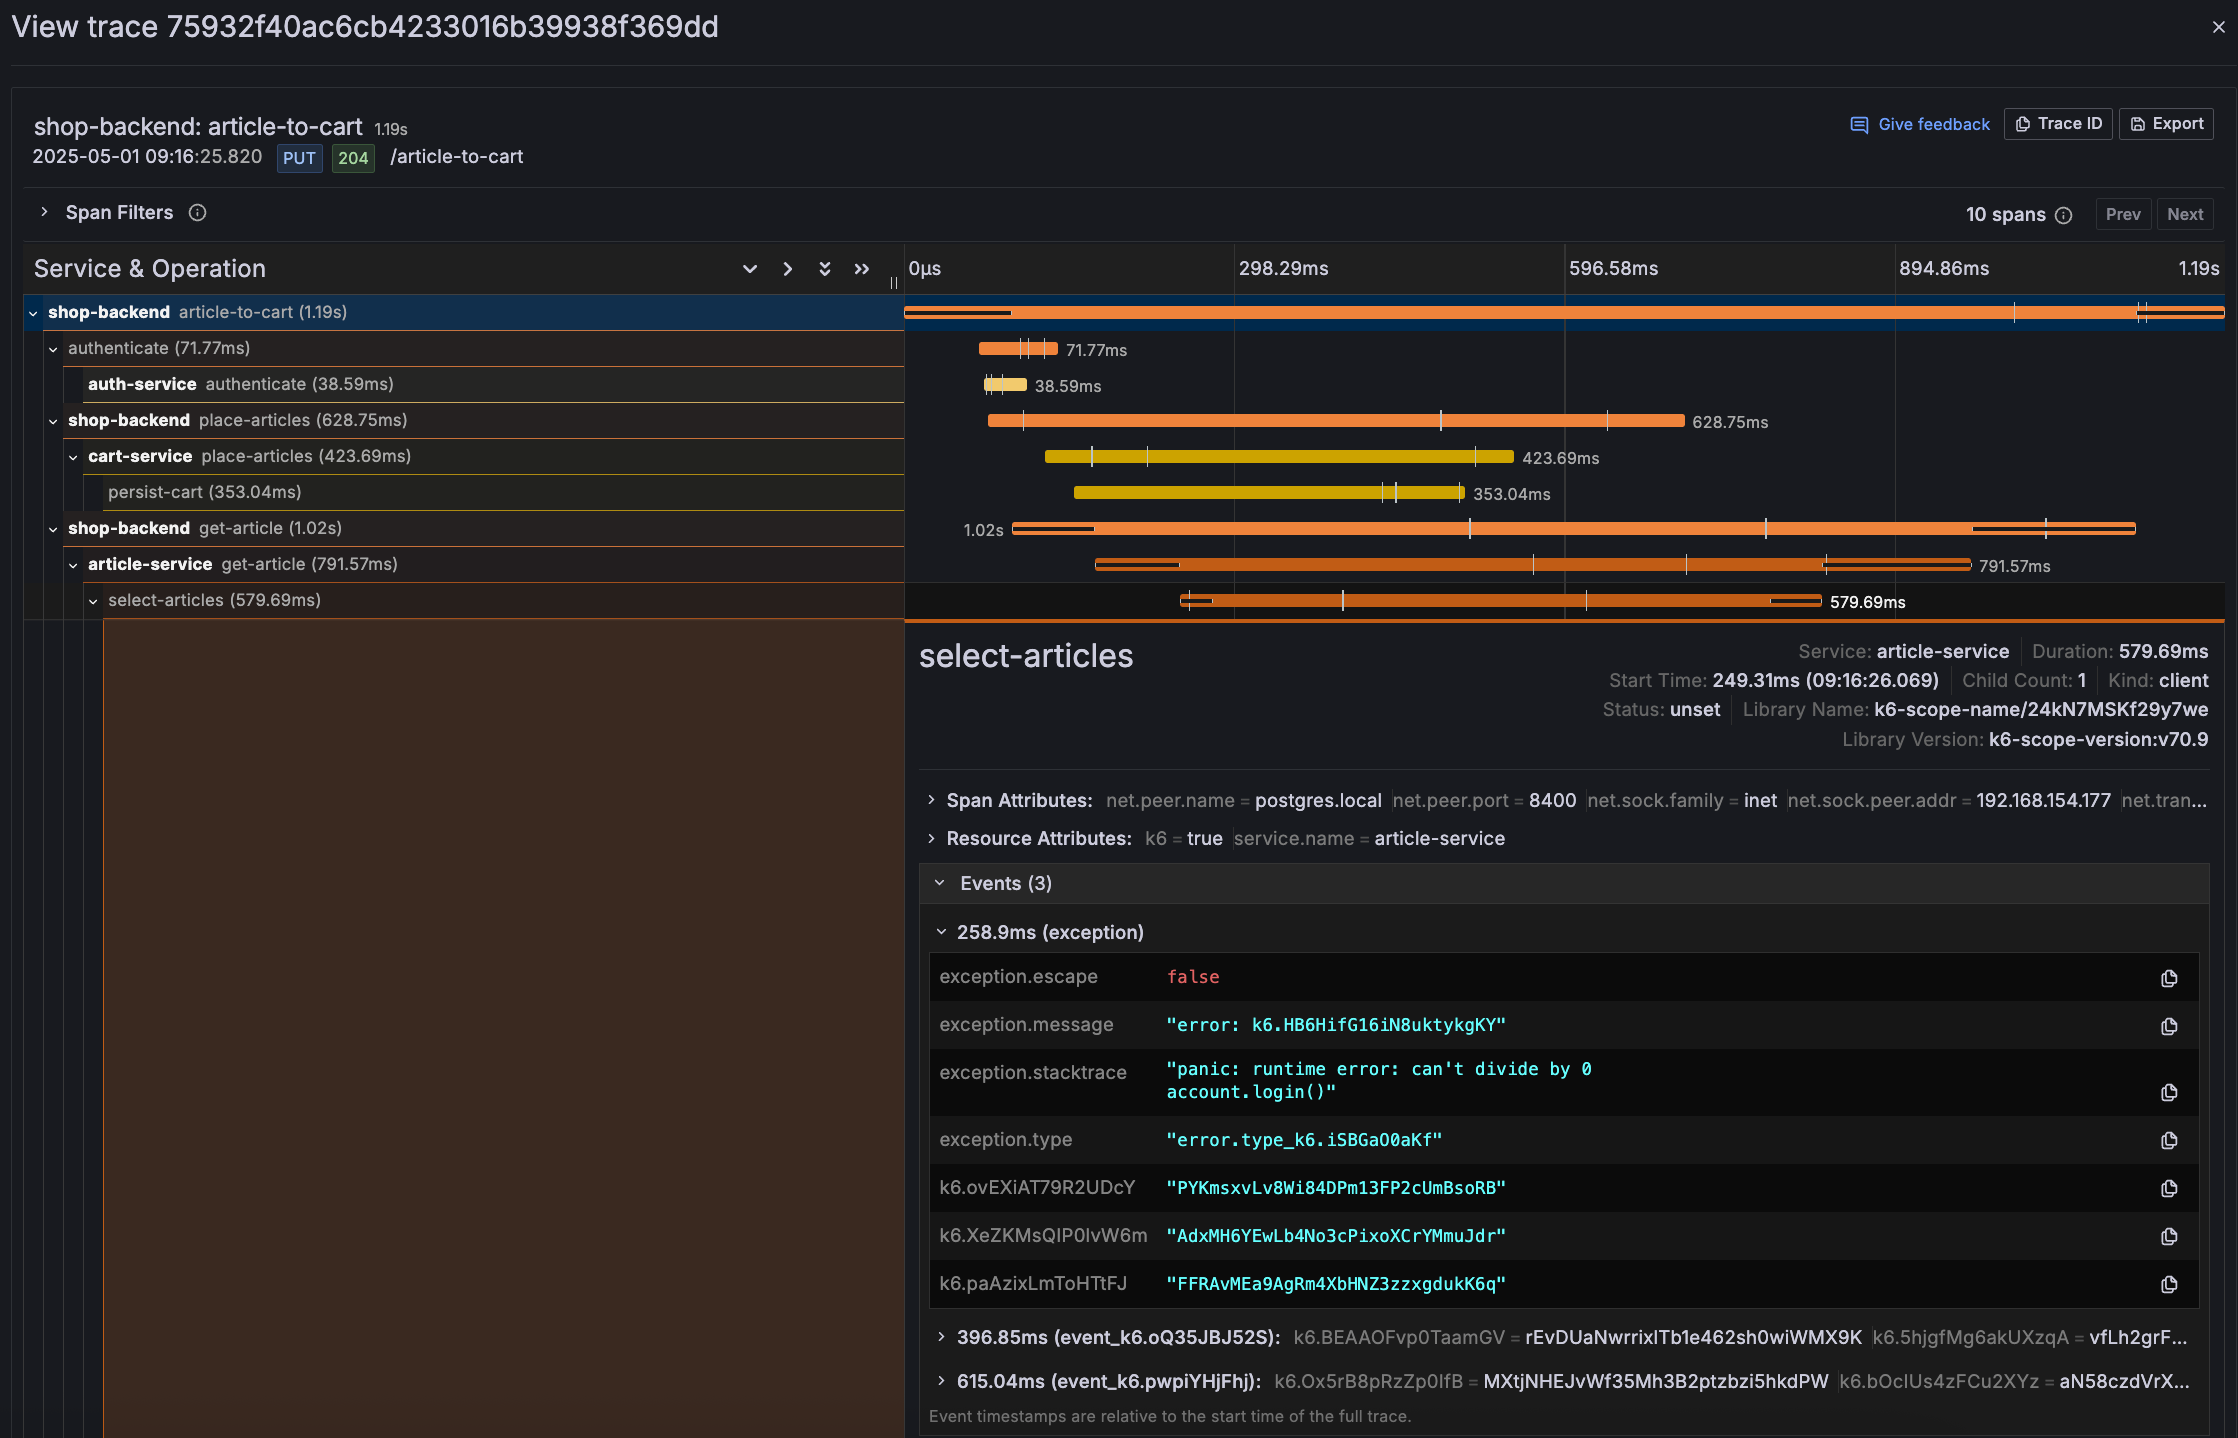
The following image provides the following insights:
- The
select-articlesspan within thearticle-serviceshows an exception with the message:error: k6.HD6HfG16NBuktkygK. This indicates a runtime error caused by a division by zero (panic: runtime error: can't divide by 0). - The stack trace and exception type (
error.type: k6_1586a00a6af) provide additional context for debugging the issue. - The
select-articlesspan took 579.69ms, with 258.9ms attributed to the exception. This suggests the error significantly impacted the span’s duration. - The span attributes indicate the issue occurred in a PostgreSQL database (
net.peer.name: postgres.local), which may point to a problematic query or data inconsistency. - The events within the span show timestamps for when the exception occurred and other related activities, helping to reconstruct the sequence of events.
The insights from the image indicate that the select-articles span is the primary contributor to the latency issue due to a runtime error caused by a division by zero, which affected the span’s duration. This issue occurred in the PostgreSQL database, pointing to a potentially problematic query or data inconsistency.
page 6 of 7