Investigate the data
Once your metrics are filtered, analyze the data to spot trends and correlations. Reviewing related metrics provides a broader understanding of your system’s performance.
Having a good understanding of your baseline metric performance at this stage makes it easy to recognize and pinpoint unusual behavior.
To analyze the data, perform the following steps:
Review the panels and identify a metric of interest.
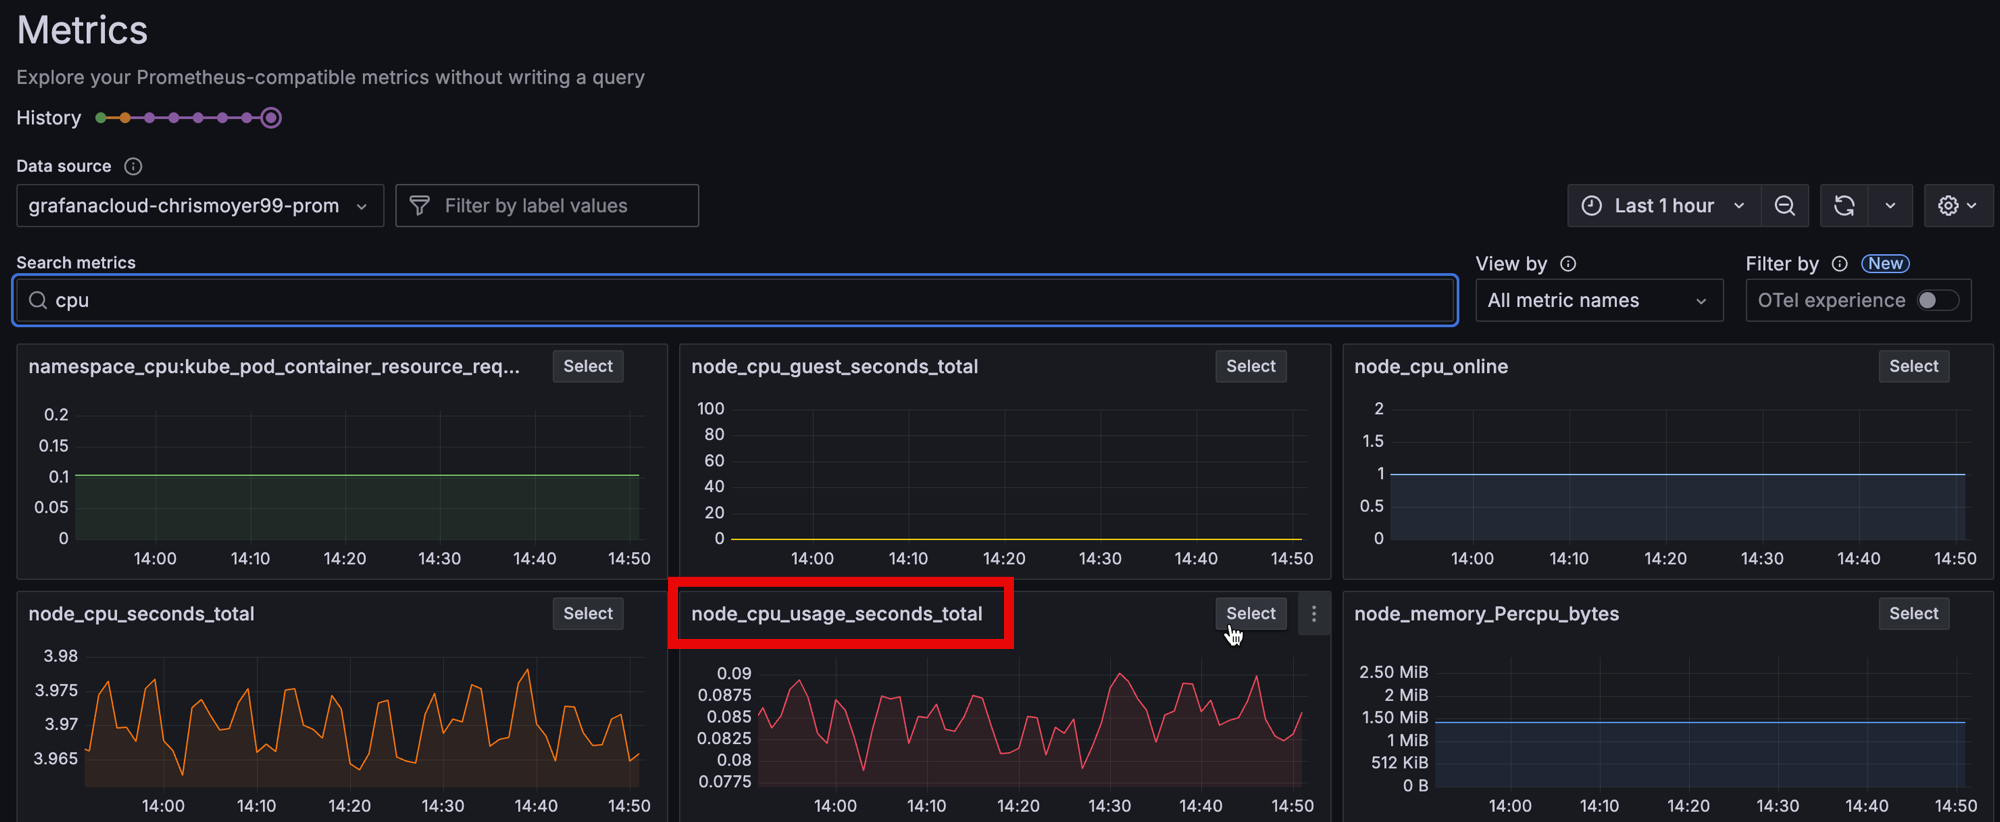
In the following example, the
node_cpu_onlineandnode_cpu_guest_secondsmetrics show little variation, making them less interesting to analyze. Thenode_cpu_seconds_totalandnode_cpu_usage_seconds_totalmetrics, which exhibit more change, are more valuable to explore.For a more detailed view of any metric, click Select in the visualization.
If necessary, use the time picker located in the upper-right of the page to adjust the time range.
Continue your investigation by reviewing the Breakdown tab and the Related metrics tab.
Breakdown: Shows time series visualizations for each of the label-value pairs for the selected metric. You can further drill down on each label and click Add to filter to add the label-value pair into your filters. You can also change the View from grid to rows.
Related metrics: Shows related metrics with relevant key words. You can repeat the drilldown process for any related metric.
In your next milestone, you’ll open the metrics in Explore view and see the query that generates the visualization.