Slide 2 of 5

Your progress

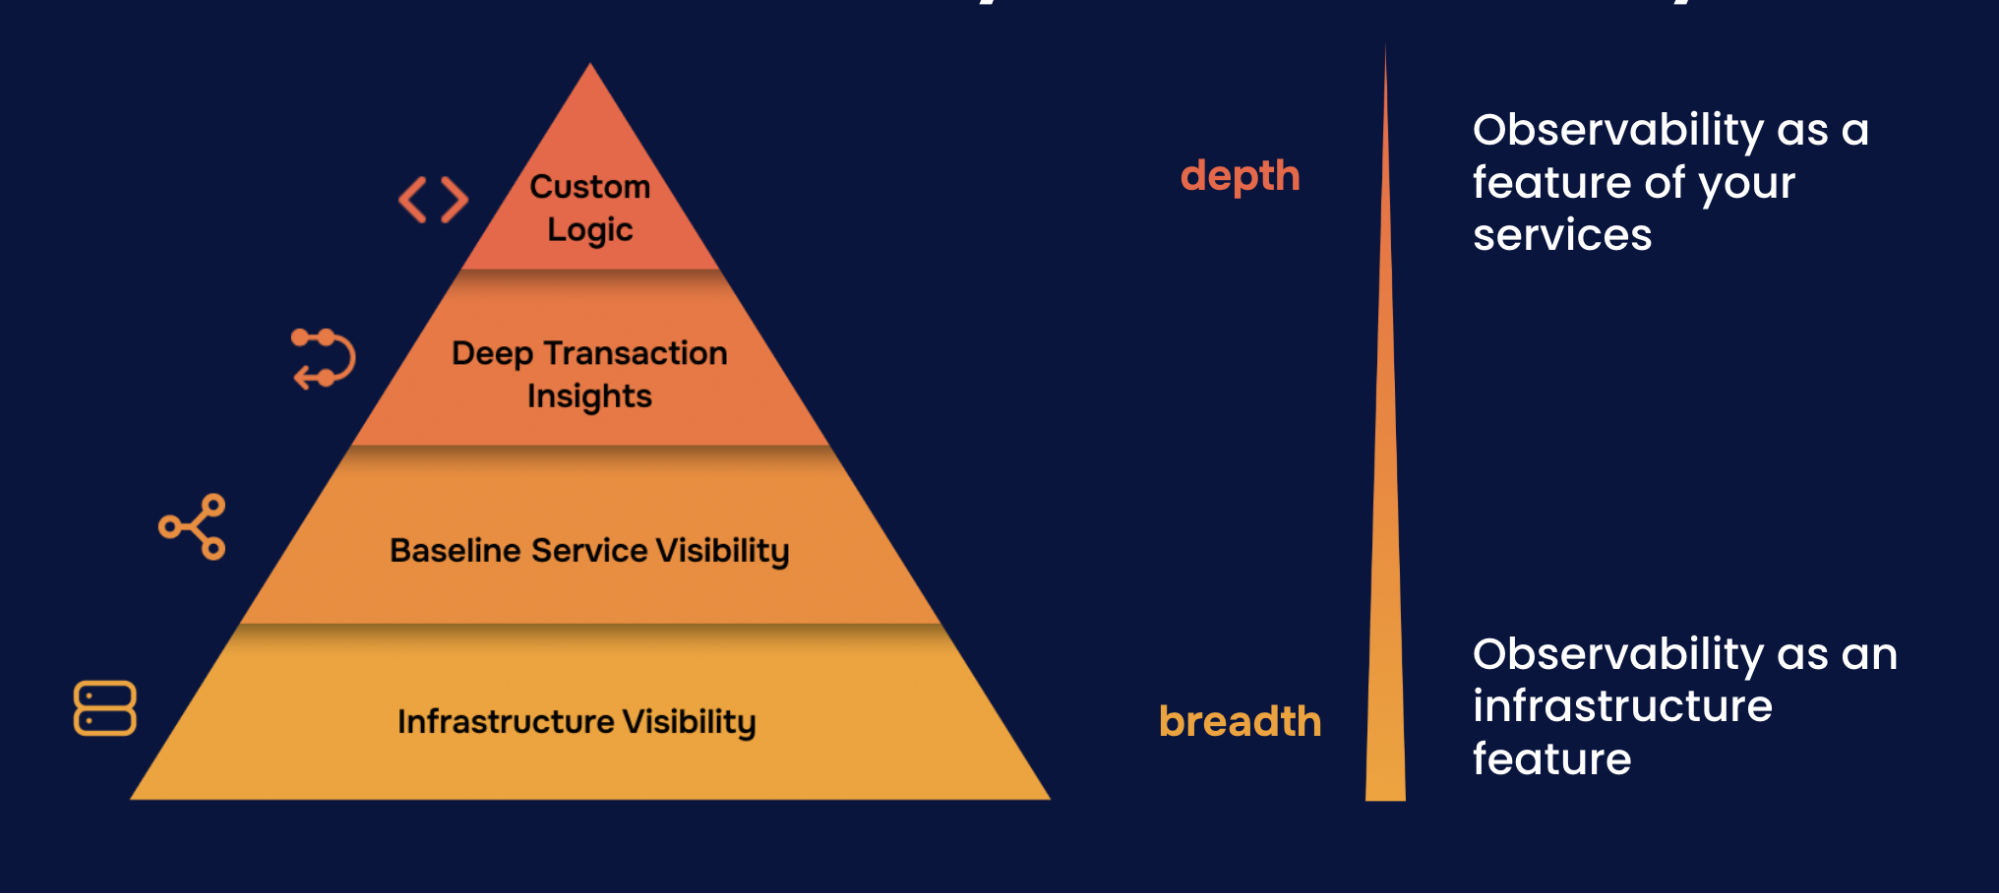
You’ve built Level 1 capabilities: Infrastructure visibility

Hierarchy of Observability Needs

Your external collectors are connected

You can now answer: “How do I get my metrics and logs into Grafana Cloud from my existing collectors?”

  • Metrics flowing via your chosen method
  • Logs stored in Loki
  • Data ready for visualization and alerting

Expand your Level 1 foundation

  • Add more collection methods: Connect additional systems and data sources
  • Deploy integrations: Get pre-built dashboards and alerts for common technologies
  • Monitor cloud providers: Add AWS, Azure, and GCP visibility

Script

By learning to send data from external collectors, you’ve built Level 1 infrastructure visibility for your systems. You can answer “Is my infrastructure healthy?” with confidence. You have metrics flowing to Mimir, logs stored in Loki, and data ready for visualization and alerting.

Using external collectors is particularly valuable if you’ve already invested in collection tools and want to preserve that investment. You get the best of both worlds: your proven collection pipeline plus Grafana Cloud’s managed backend.

One collection method is a great start, but infrastructure visibility across your entire stack is the goal. You might want to add more collection methods, connect more systems, or explore integrations for pre-built dashboards. The related courses below can help you continue building out your Level 1 foundation.