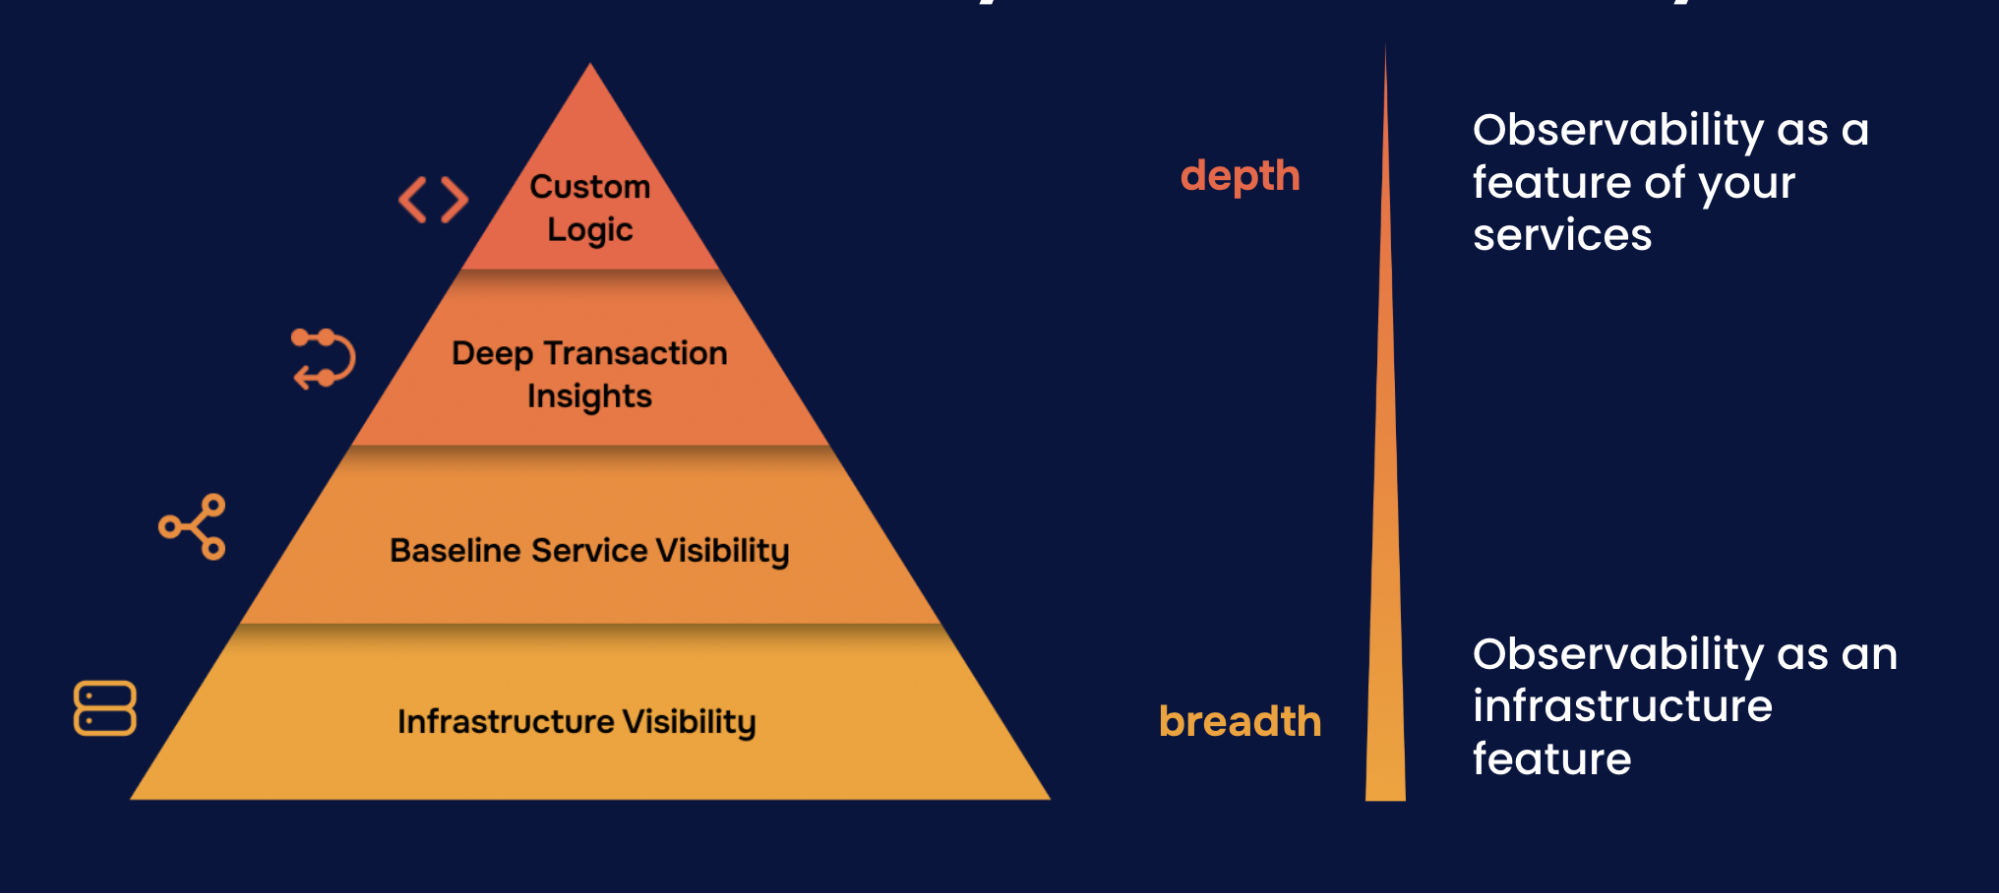
Products
Grafana Cloud
Monitor, analyze, and act faster with AI-powered observability.
LGTM+ Stack
Key Capabilities
Observability Solutions
Open Source
Community resources
Dashboard templates
Try out and share prebuilt visualizations
Prometheus exporters
Get your metrics into Prometheus quickly
end-to-end solutions
Opinionated solutions that help you get there easier and faster
monitor infrastructure
Out-of-the-box KPIs, dashboards, and alerts for observability
visualize any data
Instantly connect all your data sources to Grafana
Learn
Community and events
Resources
Help build the future of open source observability software Open positions
Check out the open source projects we support Downloads
Grafana Cloud
Monitor, analyze, and act faster with AI-powered observability.
Observability Solutions
The actually useful free plan
10k series Prometheus metrics
50GB logs, 50GB traces, 50GB profiles
500VUh k6 testing
20+ Enterprise data source plugins
100+ pre-built solutions
3 active AI users
end-to-end solutions
Opinionated solutions that help you get there easier and faster
visualize any data
Instantly connect all your data sources to Grafana
Observability builds in layers
Sending data from external collectors gives you Level 1 (infrastructure visibility).
You can’t troubleshoot services if you don’t know your infrastructure is healthy. Getting your data into Grafana Cloud builds that foundation.
| Level | Focus | Question answered |
|---|---|---|
| Level 1 | Infrastructure | “Is my server healthy?” |
| Level 2 | Services | “Which service is the problem?” |
| Level 3 | Transactions | “Why is this request slow?” |
| Level 4 | Custom logic | “What’s happening in my code?” |
Before we dive into methods for sending data, let’s zoom out and understand where this fits in the bigger picture.
Observability isn’t one thing. It’s a hierarchy of needs. At the foundation, Level 1, you need infrastructure visibility. Can you see if your servers, databases, and networks are healthy? This is the base everything else builds on.
At Level 2, you shift focus to services. Which service is causing the problem? At Level 3, you dig into individual transactions. Why is this specific request slow? And at Level 4, you add custom instrumentation for business-specific questions.
Here’s the key insight: sending data from external collectors gives you Level 1. Whether you’re using Prometheus, InfluxDB, Graphite, or OpenTelemetry, you’re building infrastructure visibility. The foundation that everything else depends on.
You can’t troubleshoot service issues if you don’t know your infrastructure is healthy. Getting your data into Grafana Cloud builds that foundation. That’s why we’re starting here.
