Slide 2 of 5

Your progress

Your observability progress

You’ve reached Level 1: Infrastructure visibility

Hierarchy of Observability Needs

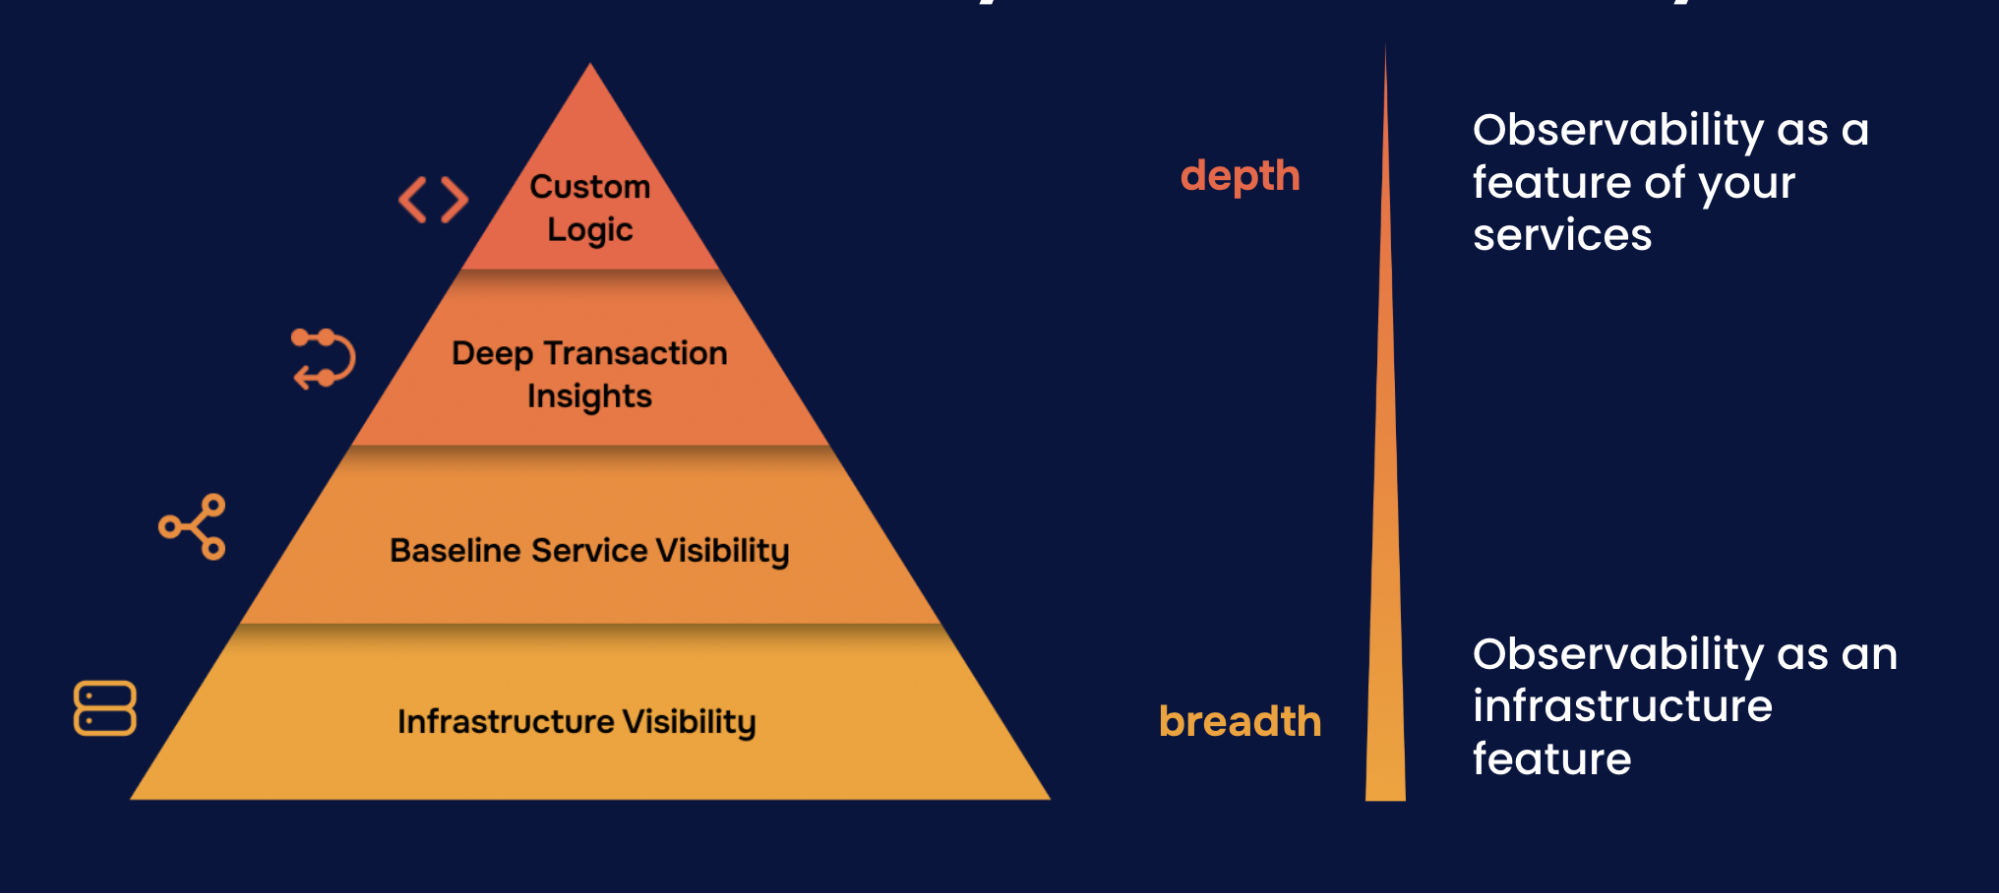
One integration is a great start. You can now answer: “Is my infrastructure healthy?”

  • Metrics flowing to Grafana Cloud
  • Pre-built dashboards for visibility
  • Alerts for common issues

Expand your Level 1 foundation

  • Add more integrations to cover databases, load balancers, and network devices
  • Explore data sources to connect systems without pre-built integrations
  • Complete the foundation with infrastructure visibility across your stack

Script

By deploying an integration, you’ve built the foundation: Level 1 infrastructure visibility for that system. You can answer “Is my infrastructure healthy?” with confidence. You have metrics flowing, dashboards showing system state, and alerts for common problems. That’s a real accomplishment. Many organizations never get this far.

Now, one integration is a great start, but most environments have multiple systems that need monitoring. You might want to add more integrations to cover your databases, load balancers, or other infrastructure. The goal is infrastructure visibility across your entire stack before moving up to Level 2.

Here are some courses that can help you round out Level 1.